2021–2022 Departmental Results Report
Download the printer-friendly version (PDF)About this publication
Publication author : Canada Economic Development for Quebec Regions
Catalogue: Iu90-1/16E-PDF
ISSN: 2561-0015
Publish date: December 2, 2022
Summary: This report deals with Canada Economic Development's principal achievements in regards to its engagements towards the Parliament. See also the highlights of this report.
Table of Contents
- From the Minister
- From the Institutional Head
- Results at a glance
- Results: what we achieved
- Spending and human resources
- Corporate Information
- Supporting information on the program inventory
- Supplementary information tables
- Federal tax expenditures
- Organizational contact information
- Appendix: definitions
- Endnotes
From the Minister
I am pleased to present the 2021–2022 Departmental Results Report from Canada Economic Development for Quebec Regions (CED). Investing a total of $391.1M in 1,486 projects, the Agency supported Quebec’s SMEs and its regions with a view to building an economy that is more innovative, resilient, sustainable, inclusive and competitive.
In a context in which the Quebec economy was dealing with structural issues such as productivity, workforce availability and supply chain disruptions, CED assistance was key. In its response to the challenges brought on by the health and financial crisis, CED demonstrated its agility by tailoring its services to the needs of Quebec’s SMEs and regions.
The Agency supported the economic resilience of the regions by expanding its offer to include targeted programs that take regional needs into account. CED invested in the growth and development of businesses to allow them to position themselves favourably in the new economic environment. CED also strengthened the capacity of the regions to develop in a sustainable manner by focusing on local realities and opportunities, such as tourism.
Through its interventions, CED is involved in government-wide efforts to reduce greenhouse gas emissions and has been committed to fighting climate change for a number of years. In doing so, CED is contributing to Canada’s strengthened climate plan entitled a Healthy Environment and a Healthy Economy.
In encourage you all to read the attached Report, which highlights CED’s achievements in 2021–2022.

Pascale St-Onge
Minister of Sport and Minister responsible for the Economic Development Agency of Canada for the Regions of Quebec
From the Institutional Head
In 2021–2022, CED played a key role in supporting Quebec’s SMEs and its regions. For the second year in a row, the post–COVID-19 economic recovery was the focal point of our interventions.
To address the challenges brought on by the pandemic, we quickly implemented five initiatives, with a focus both on innovation and the inclusive and, above all, sustainable growth of our economy. We designed a grid to facilitate the environmental monitoring of projects and to guide the SMEs that implement them.
We also assisted SMEs as they looked to adopt new ways of doing business. For example, we helped them accelerate their digital shift, ensure their cybersecurity, develop products and services or rethink their presence in foreign markets. As a result, Quebec SMEs have contributed to the rebuilding of supply chains and the boosting of local manufacturing.
With a view to continuously improving the client experience, we pursued our efforts to be innovative in our business processes, provide quality services and meet the expectations of SMEs and the organizations that support them. In this regard, we are proud of the successful rollout of our new client relationship management and grant and contribution management system.
All of these achievements would not have been possible without the continued commitment of our teams, who pulled out all the stops to address these many challenges. I would like to sincerely thank them for all their hard work.
I would also like to highlight the excellent collaboration of the many partner organizations that support us in the achievement of our mission and in so doing help foster the growth and development of the regions while helping SMEs position themselves for the transition to a greener and more inclusive economy.

Manon Brassard
Deputy Minister / President of the Economic Development Agency of Canada for the Regions of Quebec
Results at a glance
Over the course of the 2021–2022 fiscal year, the Quebec economy returned to its pre-pandemic levels, both in terms of gross domestic product and the labour market. However, this economic trajectory is uneven across sectors, regions and groups of individuals.
While some sectors have already recovered from the crisis, others are still struggling to make up lost ground, notably the arts, entertainment and recreation industry and the accommodation and food services sector. The same holds true at the regional level, with some regions of Quebec still experiencing lower levels of economic activity than before the pandemic. The asymmetry of the recovery among certain under-represented groups, such as women, youth, Indigenous peoples and racialized communities, speaks to pre-pandemic gaps that have persisted over time.
Beyond the impact of COVID-19, the Quebec economy is facing structural issues, including workforce availability and lower productivity than in the rest of Canada and the U.S, despite some catching up in recent years. Other factors that cast a cloud over Quebec’s economic profile are rising borrowing costs to help stem inflation, disruptions in global supply chains, and the war in Ukraine. In this context, delivery delays in supplies, additional costs and shortages have become the norm and are contributing to a reduction in businesses’ profit margins, growth and competitiveness.
| Funds used (Actual expenditures) | Staff (Full-time equivalents (FTEs) |
|---|---|
| $443,837,731 | 393 |
Funding from Canada Economic Development for Quebec Regions (CED) is therefore crucial to support Quebec’s regional economies and small and medium-sized businesses (SMEs). Out of a total budget of $443.8M, we invested $391.1M in 1,486 grant and contribution (G&C) projects. Upon completion, these projects are expected to generate investments totalling $4.6B.
Our priorities
In line with our Departmental PlanFootnote 1 and in response to the economic context described above, our interventions in 2021–2022 were guided by three priorities.
1. Foster the economic resilience of businesses and the regions as they emerge from the crisis
We maintained our support for businesses and organizations experiencing financial difficulties as a result of the crisis, and we expanded our programming to support the post–COVID-19 economic recovery. This was the focal point of our interventions for a second year in a row. Almost one-third of the projects supported were COVID-19–related: 536 projects—435 of which involved support and 101 targeted recovery efforts—for a total of $123.5M.
Like the other regional development agencies (RDAs), we pursued the implementation of measures launched in 2020 to mitigate the impact of the pandemic on regional businesses and economies:
Regional Relief and Recovery Fund (RRRF): $73.4M in 406 projects
Through the RRRF, CED helped maintain jobs and ensure the survival of businesses in a number of economic sectors, including retail, manufacturing and food production, at the height of the pandemic. Particular attention was paid to tourism, an anchor sector in the regions of Quebec that was hit hard by the pandemic.
Additional funding during the year allowed the RRRF to continue to serve as a safety net for SMEs and organizations that had cash flow needs but were not eligible for other federal COVID-19 financial assistance programs
Canadian Seafood Stabilization Fund (CSSF): $4.6M in 15 projects
The CSSF targeted fish, seafood and aquaculture product processors to help them defray COVID19related expenditures. CED funding helped support this industry, which plays a key role in food security and the economy in several regions of Quebec.
Regional Air Transportation Initiative (RATI): $23.2M in 14 projects
The RATI helped maintain and improve air connectivity and regional air transportation services after the pandemic severely affected this sector, which is key to the economic development of communities.
The Initiative makes up part of an interdepartmental approach spearheaded by the RDAs, in cooperation with Transport Canada (TC) and Innovation, Science and Economic Development Canada (ISEDC), aimed at supporting regional airports, small regional air carriers and companies and organizations in this ecosystem to bolster air services in the various regions of Quebec.
In addition, in the 2021 federal budget, the Canadian government announced measures and funding for a recovery focused on jobs, sustainable growth and resilience. With the help of this additional funding, CED began implementing five new initiatives in June and July 2021: the Aerospace Regional Recovery Initiative (ARRI)Footnote 2, the Canada Community Revitalization Fund (CCRF)Footnote 3, the Jobs and Growth Fund (JGF)Footnote 4, the Major Festivals and Events Support Initiative (MFESI)Footnote 5, and the Tourism Relief Fund (TRF)Footnote 6. In 2021–2022, 101 projects received funding under these initiatives for a total of $22.3M. The implementation of these initiatives will continue beyond the period targeted by this report.
2. Support business growth and development
In addition to efforts to counter the effects of the pandemic and contribute to the economic recovery, CED also maintained its regular programs. The Agency invested $161.8M in 584 business growth projects to help these businesses position themselves favourably and strategically in the post-COVID-19 competitive environment. The projects funded were designed to support the digital shift, the adoption and development of new advanced technologies, the digitization of services, and business automation. Furthermore, to help businesses expand and remain competitive, we prioritized their internationalization into global supply chains and their commercialization in foreign markets, in compliance with applicable international agreements.
Our support for business growth and development also involves support for regional innovation ecosystems. In addition to direct funding for SMEs, we invested $15.1M in 65 organizations—including industrial clusters, business incubators and accelerators, universities, college centres for technology transfer (CCTTs) and economic NPOs—to support the startup of innovative businesses and help them improve their marketing capabilities.
CED has been involved in the fight against climate change for a number of years, and we pursued our efforts in 2021–2022, contributing to Canada's strengthened climate planFootnote 7 entitled A Healthy Environment and a Healthy Economy. In the 2021 Speech from the Throne, the Government of Canada reiterated that supporting innovation and creating good green jobs to build a more resilient, sustainable and competitive economy was a priority. In line with this priority, we invested $37.2M in 116projects aimed at improving environmental performance, using less energy-intensive technologies and developing technologies to reduce businesses’ environmental footprint.
A CED Initiative to Promote the Transition to a Green Economy
We developed an environmental characterization grid to give a green lens to projects under three of the five recovery initiatives.
When completing this grid, bidders were asked to demonstrate the extent to which their project activities or regular activities are in line with a dynamic of transition towards a green economy.
3. Strengthen the economic vitality of communities
Since the crisis exacerbated many of the challenges facing Quebec’s regions and communities, we continued to focus on local realities and opportunities, particularly in sectors where the impact is greatest, such as tourism. We invested $105.8 M in 366 promising projects that consider both the regional impact and broader economic dynamics.
Specifically, we continued to support local economic development and build community capacity for sustainable development through the Community Futures Program (CFP)Footnote 8.
We also invested $3.3M in 10 Black-led business organizations through the Black Entrepreneurship Program (BEP). These organizations have long faced inadequate funding, a situation that was aggravated by the economic repercussions of COVID-19.
All of these 2021–2022 CED priorities will, to varying degrees and in a complementary manner, allow us to make progress towards achieving our departmental results outlined in the following section.
For more information on CED’s plans, priorities and results achieved, see the “Results: what we achieved” section of this report.
Results: what we achieved
Core responsibilities
Develop Quebec’s economy
Description
Support economic growth and prosperity and job creation in Quebec by means of inclusive clean growth; help SMEs grow through trade and innovation; and build on competitive regional strengths.
Results
CED and the six other RDAs work together to contribute—within the confines of their respective mandates—to the economic development of the regions of Canada.
To measure progress with respect to the achievement of its core responsibility, CED seeks to contribute to, and influence, the three departmental results below. The achievement of these objectives depends on a number of factors and CED’s intervention contributes to them to the extent of its budgets. The results achieved in 2021–2022 demonstrate our continued commitment to innovation, digital competitiveness, green growth, and economic diversification and resilience in all our regions. It should be noted that, in this rather special year, we continued to offer adjustments to our clients to facilitate the implementation of projects and to allow Quebec businesses and communities to be well-positioned to weather the crisis and benefit from the recovery.
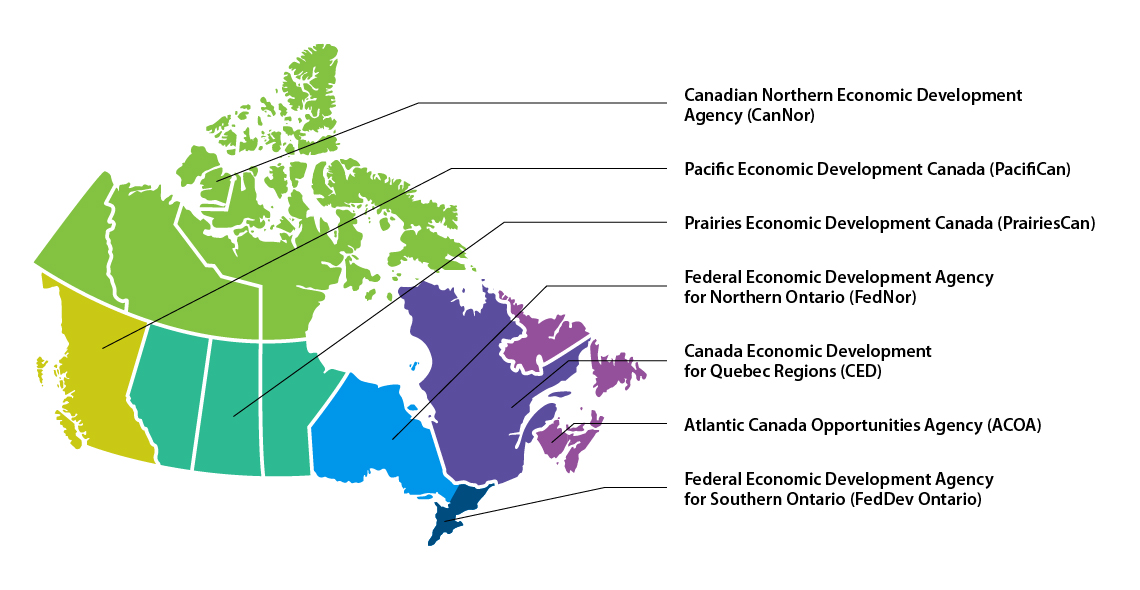
Text version of Regional representation
| Province/Territory | Regional development agency support |
|---|---|
| Alberta | Prairies Economic Development Canada (PrairiesCan) |
| British Columbia | Pacific Economic Development Canada (PacifiCan) |
| Manitoba | Prairies Economic Development Canada (PrairiesCan) |
| New Brunswick | Atlantic Canada Opportunities Agency (ACOA) |
| Newfoundland and Labrador | Atlantic Canada Opportunities Agency (ACOA) |
| Northwest Territories | Canadian Northern Economic Development Agency (CanNor) |
| Nova Scotia | Atlantic Canada Opportunities Agency (ACOA) |
| Nunavut | Canadian Northern Economic Development Agency (CanNor) |
| Ontario | Northern Ontario: Federal Economic Development Agency for Northern Ontario (FedNor) Southern Ontario: Federal Economic Development Agency for Southern Ontario (FedDev Ontario) |
| Prince Edward Island | Atlantic Canada Opportunities Agency (ACOA) |
| Quebec | Canada Economic Development for Quebec Regions (CED) |
| Saskatchewan | Prairies Economic Development Canada (PrairiesCan) |
| Yukon | Canadian Northern Economic Development Agency (CanNor) |
Departmental result 1: Quebec businesses are innovative and growing
The challenges brought on by COVID-19 mean that, to be sustainable and competitive, Quebec businesses must pursue the path of innovation. Through the Regional Economic Growth through Innovation (REGI) Program.Footnote 9 CED continued to foster business innovation and growth within businesses at all stages of their development. We assisted our SME clients in their new ways of doing business and in their efforts to reinvent themselves. For example, we funded projects to accelerate the digital shift; support e-commerce and cybersecurity; rebuild supply chains and promote local manufacturing; develop new products and services; or rethink presence in foreign markets (always in compliance with applicable international agreements).
Example of an Innovation Project
Where : Saint-Hyacinthe, served by the Centre-du-Québec Business Office (BO)
Who: Cintech agroalimentaire, a college centre for technology transfer (CCTT) that supports innovation and competitiveness in Quebec’s agri-food industry through support for research and development (R&D), consumer research and technology transfer.
What: The $3.04M funding involves the acquisition and installation of equipment that will contribute to the development of new sources of foods rich in plant-based proteins.
Example of a Productivity Project
Where: Boisbriand, served by the Greater Montréal BO
Who: Chaired and co-founded by a woman entrepreneur, LOOP Mission is a young, circular-economy business that addresses the problem of food waste by transforming fruits and vegetables that do not meet supermarket standards into cold-pressed juices.
What: The $1.2M funding will allow for the purchase of digital equipment that will enhance the company’s productive capacity, as well as, to a lesser extent, the implementation of a marketing strategy outside Canada to acquire new market shares.
In July 2021, CED launched the Jobs and Growth Fund (JGF) to support the post–COVID-19 economic recovery. The Agency invested $8.6M in 20 projects to support SMEs and the organizations that assist them in the transition to a green economy and an inclusive recovery, while improving their competitiveness and creating jobs.
Examples of a Project Funded Through the JGF
Where: Rivière-du-Loup, served by the Bas-Saint-Laurent BO
Who: Halles d’innovation et de formation avancée (HIFA), a new centre of excellence for SMEs in the packaging and manufacturing intelligence field.
What: The $9.4M funding will involve setting up an innovation centre specializing in next-generation packaging and manufacturing intelligence. The new centre will act as a development hub for manufacturing businesses in the Bas-Saint-Laurent region and will foster networking among the various players in the regional innovation ecosystem. It will also help enhance SMEs’ expertise and performance in innovative packaging, intelligent packaging systems and production lines.
As noted in the section on our priorities, we also pursued our support for the transition of businesses to the green economy. For this purpose, over $37.2M was awarded to businesses working in various fields—such as greenhouse gas reduction, the production of cleaner products, bioenergy and alternative energy, electric vehicles, digital technology and energy efficiency—to allow them to develop or adopt clean technologies or change their business practices to ensure sustainable growth.
Example of a Project – Going Green
Where: Sherbrooke, served by the BA Eastern Townships
Who: Café William Spartivento Inc. is a company that imports, roasts and distributes specialty coffees in Canada and the United States. Committed to sustainable development, the company has implemented a circular economy program that allows it to recover dozens of tons of coffee waste and jute bags each year.
What: The $2.5M funding will allow the company to acquire energy-efficient, all-electric production equipment that will improve its productivity and production capacity while reducing its carbon footprint.
In addition to direct business support, CED is contributing to the creation of an entrepreneurial environment conducive to innovation by supporting the players in regional innovation ecosystems. We funded 28 incubator and accelerator projects worth $6.1M to support the start-up and growth of technology and innovation businesses.
Example of a Project – Incubators and Accelerators
Where: Laval, served by the Greater Montréal BO
Who: Centre québécois d’innovation en biotechnologie (CQIB), an NPO that acts as a one-stop shop to facilitate the creation, growth and success of the next generation of life sciences and medical technology businesses.
What: The $1.4M funding targets the operations of the organization, which provides an ecosystem that serves startup businesses to promote their rapid, sustainable and commercialization-oriented development
CED continued to promote the capacities of Quebec’s SMEs and research centres among prime contractors, to allow them take advantage of the opportunities generated by the Industrial and Technological Benefits (ITB) PolicyFootnote 10. We organized the first ever defence sector webinar, which focused on the innovation/R&D component. The event was attended by over 100 participants and provided an opportunity to introduce research centres to the defence sector. We also collaborated in the organization of the second virtual Symposium on the Canadian Defence and Security Market in Quebec, which attracted nearly 300 participants, including OEMs, SMEs, major Quebec sectoral partners and a number of federal representatives.
Departmental result 2: Communities are economically diversified in Quebec
When the pandemic put a strain on a number of economic sectors crucial to Quebec’s local and regional economies, CED stepped up its efforts to help communities recover and diversify their activities. Incidentally, our leverage for community projects reached $2.23, which is higher than the previous year, reflecting our increased and ongoing commitment to make up for the lack or withdrawal of other financial partners in the context of the pandemic.
Our approach builds on local realities and opportunities. It favours investments that have a direct impact on communities, including support for access to regional markets, infrastructure and anchor sectors such as tourism.
Example of a Tourism Project
Where: Desbiens, served by the Saguenay–Lac-Saint-Jean BO
Who: Société récreocouristique de Desbiens Inc., an NPO that owns the “Trou de la Fée” cave tourism site located in the Metabetchouan River gorge, the only natural interpretive and observation site for bats in Quebec.
What: The $985K funding includes the addition of aerial walkways, a suspension bridge and other facilities to enhance the visitor experience and boost the site’s drawing power.
As in previous years, we pursued our support for SMEs in all regions of Quebec by providing funding for the organizations that assist them. This includes the 57 Community Futures Development Corporations (CFDCs), the 10 Business Development Centres (BDCs) and the Network of CFDCs and BDCs. A total of $33.1M in funding under the CFP enabled these organizations to support local projects and pursue their mission to support economic development in rural regions.
In addition to contributing to the vitality of the regions through our regular programs—including the Quebec Economic Development Program (QEDP)Footnote 11 and the CFP—we have implemented several additional initiatives to help communities recover from the pandemic, including the:
Canada Community Revitalization Fund (CCRF): $4.9M in 44 projects
The CCRF is a national program aimed at revitalizing communities across the country. The funding supports NPOs, municipalities, public institutions and Indigenous communities in their infrastructure projects that involve revitalizing downtown cores and main streets, reinventing outdoor spaces, creating green infrastructure and improving the accessibility of community spaces.
Example of a Project Funded Through the CCRF
Where: Pohénégamook, served by the Bas-Saint-Laurent BO
Who: Town of Pohénégamook
What: The $118K funding involves setting up an outdoor meeting area with electric charging stations and urban furniture, in the vicinity of a new service building and the town hall.
Tourism Relief Fund (TRF): $3.5M in 30 projects
The TRF has helped regional tourism organizations and businesses adjust their activities to meet public health requirements, while investing in products and services to facilitate their growth going forward.
Example of a project funded through the TRF
Where: Saguenay, served by the Saguenay–Lac-Saint-Jean BO
Who: Tours aventure Fjord et Monde Inc., a company that organizes excursions and guided tours along the Route du Fjord and in the La Baie borough
What: The goal of this $39,000 funding is to set up an electric bicycle tour service that will help raise the profile of the destination and improve its tourism offer, notably for cruise ship passengers.
Major Festivals and Events Support Initiative (MFESI): $3.9M in 3 projects
The MFESI aims to support major festivals affected by the pandemic by helping them, not only to remain in business and adapt their operations, but also to better position themselves vis-à-vis economic recovery and growth.
Example of a project funded through the MFESI
Where: St-Tite, served by the Mauricie BO
Who: Festival western de St-Tite Inc.
What: The $3.9M funding, to take place over two years, will allow the Festival to adapt and enhance its products and experiences to the post-pandemic context, specifically by introducing virtual programming involving the streaming of rodeos and shows; the implementation of a new digital marketing strategy; and the annualization of certain shows and exhibitions.
Inclusive economy
Besides helping to level the playing field in terms of the recovery in the various communities of Quebec, CED is also committed to promoting the full participation of under-represented groups. We maintained our commitment to foster inclusive prosperity and equal opportunities for all, as demonstrated by the following examples of results.
- Indigenous peoples: $8.5M invested in 59 projects led by Indigenous entrepreneurs or organizations to promote Indigenous entrepreneurship, business development and assets.
- Women: $102.8M invested in 360 projects, broken down as follows: $4.2M for 8 projects under the Women Entrepreneurship Strategy (WES) to promote gender equality and the economic autonomy of women entrepreneurs through funding for the organizations that assist them; and $98.6M for 352 projects by businesses led or owned by women through our regular programs.
- Black communities: $3.3M invested in 10 projects involving business associations run by members of Black communities, through the BEP. By supporting the entrepreneurship ecosystem, this program helps Black business owners and entrepreneurs access funding and capital, as well as mentoring, financial planning services and business management training.
- Official language minority communities (OLMCs): $2.1M invested in 13 projects targeting OLMCs as part of the Economic Development Initiative (EDI).
Example of a Women Entrepreneurship Support Project
Where: Val d’Or, served by the Abitibi-Témiscamingue–Nord-du-Québec BO
Who: Cible Petite-Enfance Inc., a business owned by two women entrepreneurs that provides specialized services for daycares
What: The goal of the $101K funding is to develop a new digital platform that will allow the business to increase its sales and innovation potential.
Example of an OLMC Support Project
Where: Gesgapegiag, served by the Gaspésie–Îles-de-la-Madeleine BO
Who: The Micmacs of Gesgapegiag Band governs the members of this Indigenous community located on the south shore of the Gaspé Peninsula, provides them with services and programs, and advocates for their rights.
What: The goal of the $156K funding is to develop and implement priority tourism projects for the period from 2019 to 2023 for the community, the majority of whose members’ mother tongue is English.
Departmental result 3: Businesses invest in the development and commercialization of innovative technologies in Quebec
In 2020–2021, CED continued to support businesses that develop and market innovative products and services. Through the REGI program, we provided $10.5M for 93 marketing projects.
Example of a Marketing Project
Where: Gatineau, served by the Outaouais BO
Who: Inteloom Inc., a Gatineau-based business that specializes in the design of object-oriented management tools. This approach allows projects to be broken down into manageable elements, based on the generic nature of these units (referred to as objects).
What: The $200K funding will allow the company to market an innovative software solution.
Aerospace Regional Recovery Initiative (ARRI): $1.42M for 4 projects
Recognizing the major role that the aerospace industry plays in terms of the value of Quebec exports, and the impact the pandemic has had on this sector, CED launched the national ARRI in June 2021. The program supports projects by aerospace companies and the organizations that assist them in order to help them green their operations, adopt environmentally sustainable practices and remain at the cutting edge of technology. Through the ARRI, we supported businesses that adopt clean technologies and green their operations, and we fostered their marketing and export activities.
Example of a Project Funded Through the ARRI
Where: Salaberry-de-Valleyfield, served by the Mauricie BO
Who: Meloche Group (MG), a company that specializes in precision machining, surface treatment, painting, assembly, and manufacturing engineering for the aerospace and defence sector. MG is part of the aerospace value chain and acts as a subcontractor for major OEMs such as Pratt & Whitney Canada, GE Canada, Bombardier Aerospace and CAE.
What: The $2.9M funding targets the greening of operations, the adoption of environmentally sustainable practices, and improved productivity. MG is also working with its clients to adopt environmentally responsible practices by developing parts and processes to reduce the aerospace industry’s carbon footprint (e.g., more energy-efficient industrial processes; improved part life cycle and performance).
We also awarded $60.8M to 159 organizations that support SMEs at critical times in the implementation of their business projects involving the adoption, adaptation and marketing of technologies aimed at improving their productivity, boosting their growth and enhancing their competitiveness. These include clean-tech organizations; organizations that foster the transfer of technologies to SMEs or entrepreneurship within universities; and organizations that provide support for export or marketing projects.
Example of a Project with an ORPEX
Where: Baie-Comeau, served by the Côte-Nord BO
Who: Commerce international Côte-Nord, a non-profit regional export promotion organization (ORPEX)
What: This $411K funding will allow the organization to continue supporting Côte-Nord SMEs in their commercialization efforts in external markets, notably by providing training and information, support, and consultation services to prepare them for exporting and to help them diversify their markets.
Examples of Projects with a Centre for Technology Transfer
Where: Québec, served by the Québec–Chaudières-Appalaches BO
Who: National Optics Institute (INO), he largest optics and photonics centre of expertise in Canada.
What: The $52.8M funding for two projects covers operating costs as well as the acquisition of scientific, technical and IT equipment so that the INO can continue to support the development of technological innovations and share its R&D expertise with industry players in Quebec and Canada.
Gender-based analysis plus
We continued to align our policies and programs with the Government of Canada’s equity and inclusion commitments and guidelines, and with the Gender-based Analysis Plus (GBA Plus) framework implemented at CED in 2018.
Highlights of Funding for Under-Represented Groups
We provided $35.9M for 260 projects by SMEs that are majority owned by members of under-represented groups, and $109.7M for 248 NPO projects specifically targeting members of these groups.
At the beginning of the fiscal year we introduced a new voluntary self-reporting form for our clients. The form was updated for the first time since 2018 to reflect best practices in collecting gender and diversity data for federal business support programs and services. The updated form now includes definitions of under-represented groups to better guide clients with respect to these groups. Its scope was also expanded to include new categories, including newcomers and immigrants; people from Black communities; and members of 2SLGBTQI+ communities. The renewed form will improve the granularity and transparency of the collection of gender and diversity data from our clients. Its adoption will also allow us to undertake work that will help us gain a better understanding of how SMEs and NPOs integrate the principles of equity, diversity and inclusion (EDI) into their organizational planning and will enable us to better address the challenges associated with the participation of under-represented groups in the regions of Quebec.
We also contributed to GBA+ for the BEP, and in the design of the five new national initiatives mentioned above (JGF, ARRI, TRF, MFESI and CRCF).
The GBA+ for the above initiatives served to assess the impact on the various population groups and ensure that they contribute to inclusive growth in the regions of Quebec. In particular, the analysis confirmed that the pandemic has aggravated pre-existing regional disparities and inequalities. In this regard, the proposed initiatives were designed to increase the participation, not only of under-represented groups, but also of certain devitalized regions of Quebec.
For more information on CED’s intervention with respect to GBA+ and under-represented groups, please refer to the Gender-based Analysis Plus Supplementary Information TableFootnote 12.
United Nations 2030 Agenda for Sustainable Development and the Sustainable Development Goals
For more information on how CED is advancing the UN Sustainable Development Goals, please refer to the Agency’s 2021–2022 Departmental Sustainable Development Strategy ReportFootnote 13.
Experimentation
CED was not involved in any experimentation during the period in question; instead, the organization focused on maintaining and optimizing its tools and processes, which included the rollout of a new grant and contribution management system.
Key risks
Risk 1: Information Technology (IT) security
The COVID-19 pandemic has highlighted the dependence and risks associated with technological infrastructure and the protection of sensitive data. Public organizations are a prime target. Attackers could take control of our infrastructure (ransomware) and steal or alter sensitive data. Surveillance measures and technological tools have been put in place and our critical applications are continuously monitored. In 2021–2022, CED developed and implemented a new cybersecurity strategy that allowed the Agency to increase active systems’ monitoring, expand its vulnerability assessments and raise staff awareness about cybersecurity (phishing, physical intrusion and endpoint protection).
Risk 2: Workforce health and well-being and remote management
The various waves of the pandemic, changing health guidelines, and new variants mean that organizations and workers need to be flexible. However, one thing is certain: the pandemic has had a lasting impact on the world of work, notably through the introduction of remote and hybrid work arrangements, which can have negative psychological effects on staff. For example, some people may feel the effects of isolation or increased family obligations when working from home. Since CED is a small, decentralized organization, the record number of recovery initiatives being carried out puts additional pressure on the organization’s workforce, which is already working hard to deliver on its regular obligations and business activities. This pressure on the workforce is exacerbated by labour shortages in a number of job categories across the organization. This context could impact staff health and well-being.
In 2021–2022, we introduced flexible work schedules to facilitate a work-family balance. We also provided training for managers on the new reality of remote management and increased the number of communication channels in order to find out how employees were doing and to be able to react swiftly, if needed. We also developed a toolkit that included training on various topics such as well-being, safety and management. We will remain open to the needs of the managers’ community, and we will continue to develop training and tools to better support managers in the new world of work. The services of a Mental Health and Wellness Ombuds were also available. As regards the labour shortage, CED has been working hard to attract and retain a competent and diverse workforce.
Risk 3: Program delivery
The federal government has set up relief funds to support businesses and communities experiencing difficulties stemming from the COVID-19 pandemic. At CED, this exceptional situation has prompted us to speed up the design and implementation of new programs; however, there are risks associated with the development of these programs and the management of guidelines and controls. To mitigate this risk, CED set up multidisciplinary teams to ensure a common understanding of the new initiatives and to oversee the sharing of information. We also developed and implemented rigorous risk-based analytical procedures and post-audit mechanisms, while closely monitoring projects to ensure adequate controls.
Results achieved
The following table shows, for CED, the results achieved, the performance indicators, the targets and the target dates for 2021–22, and the actual results for the three most recent fiscal years for which actual results are available.
| Departmental results | Performance indicators | Target | Target achievement date | 2019–20 actual results | 2020–21 actual results | 2021–22 actual results |
|---|---|---|---|---|---|---|
| R1: Quebec businesses are innovative and growing | Number of high-growth businesses in Quebec (by income) | No forecast* | March 31, 2022 | Not available (N/A)** | 3,030 | 3,400 |
| Value of Québec's goods exports | No forecast* | March 31, 2022 | $88.6B | $82.6B | $97.2B | |
| Value of Quebec Clean Technology Exports | No forecast* | March 31, 2022 | $2.5B | N/A** | $2.4B | |
| Revenue growth rate of businesses supported by CED programs | 4.0% | March 31, 2022 | N/A** | N/A** | 4.4% | |
| R2: Quebec communities are economically diversified | Percentage of SMEs in Quebec that are majorityowned by women, Indigenous peoples, youth, visible minorities or persons with disabilities |
No forecast* |
March 31, 2022 |
Women: N/A** Indigenous peoples: N/A** Youth: N/A** Visible minorities: N/A** Persons with disabilities: N/A** |
Women: N/A** Indigenous peoples: N/A** Youth: N/A** Visible minorities: N/A** Persons with disabilities: N/A** |
Women: 16% Indigenous peoples: 1.1% Youth: 14.4% Visible minorities: 4.3 % Persons with disabilities: 0.4% |
| Percentage of professional jobs in science and technology in the Quebec economy | No forecast* | March 31, 2022 | 36.6% | 39.1% | 38.8% | |
| Amount leveraged per dollar invested by CED in community projects | $2.20 | March 31, 2022 | $2.24 | $1.80 | $2.23 | |
| R3: Businesses invest in the development and commercialization of innovative technologies in Quebec | Value of R&D spending by businesses receiving CED program funding | $25M | March 31, 2022 | $62M | $32M | N/A** |
| Percentage of businesses that collaborate with Quebec institutions of higher learning | No forecast* | March 31, 2022 | N/A** | 23.1% | N/A** |
* "No forecast" means a target for which CED cannot provide a forecast owing to its limited influence. The current COVID-19 situation has created an unprecedented context in which it is impossible to establish rigorous economic forecasts for these targets.
** "Not available" means that no data was published by Statistics Canada for the fiscal year in question.
*** The data in the table corresponds to the most recent results published by Statistics Canada. The figures for previous years are those available and can be updated in the current or future fiscal years.
Financial, human resources and performance information for CED’s Program Inventory is available in GC InfoBaseFootnote 14.
Budgetary financial resources (dollars)
The following table shows, to Develop Quebec’s economy, budgetary spending for 2021–22, as well as actual spending for that year.
| 2021–22 Main Estimates |
2021–22 planned spending |
2021–22 total authorities available for use |
2021–22 actual spending (authorities used) |
2021–22 difference (actual spending minus planned spending) |
|---|---|---|---|---|
| 346,277,629 | 346,277,629 | 525,724,395 | 419,042.755 | 72,765.126 |
Financial, human resources and performance information for CED’s Program Inventory is available in GC InfoBaseFootnote 15.
Human resources (full-time equivalents)
The following table shows, in fulltime equivalents, the human resources the department needed to fulfill this core responsibility for 2021–22.
| 2021–22 planned full-time equivalents |
2021–22 actual full-time equivalents |
2021–22 difference (actual full-time equivalents minus planned full-time equivalents) |
|---|---|---|
| 195 | 213 | 18 |
Financial, human resources and performance information for CED’s Program Inventory is available in GC InfoBaseFootnote 16.
Internal services
Description
Internal services are those groups of related activities and resources that the federal government considers to be services in support of programs and/or required to meet corporate obligations of an organization. Internal services refers to the activities and resources of the 10 distinct service categories that support program delivery in the organization, regardless of the internal services delivery model in a department. The 10 service categories are:
- acquisition management services
- communication services
- financial management services
- human resources management services
- information management services
- information technology services
- legal services
- material management services
- management and oversight services
- real property management services
Imagining 2024 is the result of strategic reflection aimed at ensuring that CED remains a modern, recognized organization that is close to its client base. This reflection allowed us to establish annual priorities and adapt our internal management practices for the purpose of delivering our services to our internal and external clients.
In 2021–2022, we had three main priorities:
- Provide a safe, optimal hybrid work environment
- Take advantage of the opportunities arising from new initiatives to increase CED’s influence and visibility
- Pursue the modernization of the client experience
We made progress on all fronts, despite a full agenda composed of five new initiatives, two major transformation projects—SAP and CORTEX—and a change of government. Deliverables included
- the launch of the Future of Work pilot project, including hybrid-ready workplaces (office fit-ups, technologies and health measures);
- the rollout of the SAP financial solution;
- the launch of CORTEX, the new G&C management system;
- the redesign of CED’s website, based on user needs, including accessibility for persons with disabilities. The new site, which went live in October 2021, features simplified plain-language content, making it easier for users to quickly find the information they are looking for;
- the Public Service Employee Survey (PSES) consultation tour; and
- the pursuit of the activities of the Innovation Incubator, including the launch of Innovation Month and the Digital Dexterity Hub. Digital empowerment activities were conducted, including several learning clinics and the development of a digital skills framework.
Budgetary financial resources (dollars)
The following table shows, for internal services, budgetary spending for 2021–22, as well as spending for that year.
| 2021–22 Main Estimates |
2021–22 planned spending |
2021–22 total authorities available for use |
2021–22 actual spending (authorities used) |
2021–22 difference (actual spending minus planned spending) |
|---|---|---|---|---|
| 20,204,199 | 20,204,199 | 23,616,226 | 24,794,976 | 4,590,777 |
Human resources (full-time equivalents)
The following table shows, in fulltime equivalents, the human resources the department needed to carry out its internal services for 2021–22.
| 2021–22 planned full-time equivalents |
2021–22 actual full-time equivalents |
2021–22 difference (actual full-time equivalents minus planned full-time equivalents) |
|---|---|---|
| 175 | 180 | 5 |
Spending and human resources
Spending
Spending 2019–20 to 2024–25
The following graph presents planned (voted and statutory spending) over time.
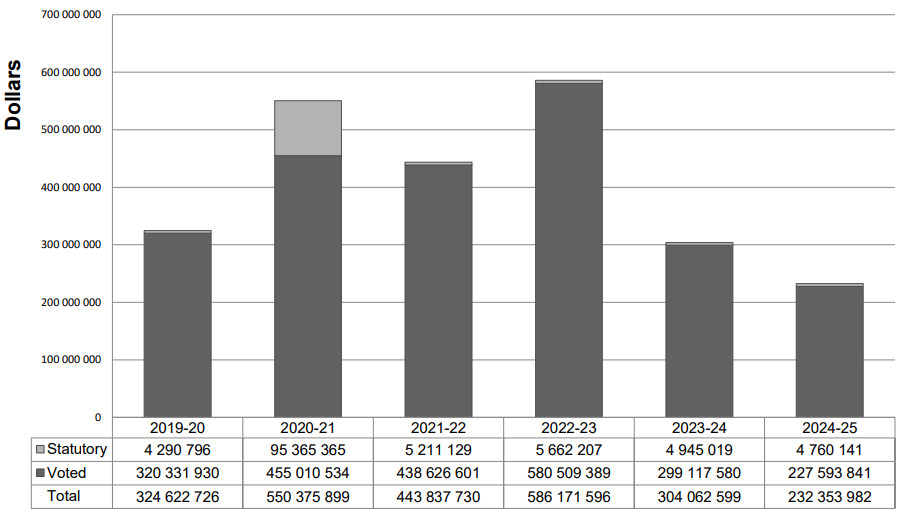
Long Description
From 2019-2020 to 2024-2025, planned statutory spending reached:
- $4,290,796 in 2019-2020
- $95,365,365 in 2020-2021
- $5,211,129 in 2021-2022
- $5,662,207 in 2022-2023
- $4,945,019 in 2023-2024
- $4,760,141 in 2024-2025
From 2019-2020 to 2024-2025, planned voted spending reached:
- $320,331,930 in 2019-2020
- $455,010,534 in 2020-2021
- $438,626,601 in 2021-2022
- $580,509,389 in 2022-2023
- $299,117,580 in 2023-2024
- $277,593,841 in 2024-2025
From 2019-2020 to 2024-2025, total planned spending reached:
- $324,622,726 in 2019-2020
- $550,375,899 in 2020-2021
- $443,837,730 in 2021-2022
- $586,171,596 in 2022-2023
- $304,062,599 in 2023-2024
- $232,353,982 in 2024-2025
Spending varies over time, primarily as a result of temporary and targeted funding received by CED. In 2020–2021, spending reached $550.4M, which included a significant increase in statutory spending ($95.4M). This increase in spending is mainly attributable to the new funding received to address the economic crisis brought on by COVID-19. Exceptionally, CED used a temporary statutory appropriation to administer this funding, given the urgency of the situation. Various initiatives were put in place to support SMEs and NPOs during the pandemic, including the RRRF, a targeted temporary initiative with a total envelope of $281.4M for CED in 2020–2021.
The decrease in spending in 2021–2022 corresponds to the decrease in funding for targeted temporary COVID-19–related initiatives such as the RRRF. Furthermore, given the particular economic conditions—labour shortages, the cost of material and supply issues—many projects were slowed down and planned spending was moved back to 2022–2023.
Planned spending in 2022–2023 will peak at $586.2M. This increase is mainly a result of funding received for the new economic recovery initiatives launched in 2021–2022 to support the economy, the details of which are provided in the following section. The carry-over of G&C funds from unused budgets in 2021–2022 also contributes to the increase in planned spending in 2022–2023.
Conversely, the repayment moratorium in 2020–2021 designed to help our clients deal with liquidity constraints brought on by the pandemic has led to a shortfall in G&C budgets. These repayments will be reinvested in budgets two years after their collection, which will take place over a longer period than originally planned. It should be noted that this decrease does not appear in the graph, since it is offset by recovery initiatives and carry-over funds.
Finally, the decrease in planned spending from 2023–2024 onwards can be explained by the anticipated end of funding for certain recovery initiatives, as outlined in the section below.
It should also be noted that planned spending in 2023–2024 does not include the reinvestment of revenue from our clients’ contribution repayments because the authorities had yet to be received at the time of the drafting of this Report.
Budgetary performance summary for core responsibilities and internal services (dollars)
The “Budgetary performance summary for core responsibilities and internal services” table presents the budgetary financial resources allocated for CED’s core responsibilities and for internal services.
| Core responsibility and internal services | 2021–2022 Main Estimates |
2021–2022 planned spending |
2022–2023 planned spending |
2023–2024 planned spending |
2021–2022 total authorities available for use |
2019–2020 actual spending (authorities used) |
2020–2021 actual spending (authorities used) |
2021–2022 actual spending (authorities used) |
|---|---|---|---|---|---|---|---|---|
| Develop Quebec’s economy | 346,277,629 | 346,277,629 | 563,047,357 | 283,642,640 | 525,724,395 | 303,896,531 | 527,799,525 | 419,042,755 |
| Internal services | 20,204,199 | 20,204,199 | 23,124,239 | 20,419,959 | 23,616,226 | 20,726,195 | 22,576,374 | 24,794,976 |
| Total | 366,481,828 | 366,481,828 | 586,171,596 | 304,062,599 | 549,340,621 | 324,622,726 | 550,375,899 | 443,837,731 |
CED’s budget consists of recurrent funding used to deliver regular programs, and temporary funding used to deliver targeted temporary initiatives. The recurrent budget remains stable over time, whereas temporary budgets vary according to the economic situation.
Planned spending in 2022–2023 will reach $586.2M. The increase is mainly a result of funding received for economic recovery initiatives, including
- $36M for the Aerospace Regional Recovery Initiative (ARRI)
- $69M for the Tourism Relief Fund (TRF)
- $75M for the Major Festivals and Events Support Initiative (MFESI)
- $69M for the Jobs and Growth Fund (JGF)
- $51M for the Canada Community Revitalization Fund (CCRF)
The anticipated decrease in planned spending in 2023–2024 is partially attributable to the fact that the following initiatives are set to end on March 31, 2023:
- TRF
- MFESI
- CCRF
It should be noted, however, that in order to meet the needs of Quebec SMEs and communities, reprofile requests for all the economic recovery initiatives have been submitted to the Department of Finance. These requests include a one-year extension for the three abovementioned initiatives. The authorities had yet to be obtained at the time of drafting of this Report, as the requests were in the process of being analyzed by the Department of Finance.
Human resources
The “Human resources summary for core responsibilities and internal services” table presents the full-time equivalents (FTEs) allocated to each of CED’s core responsibilities and to internal services.
| Core responsibility and internal services | 2019–2020 actual fulltime equivalents |
2020–2021 actual fulltime equivalents |
2021–2022 planned full-time equivalents |
2021–2022 actual fulltime equivalents |
2022–2023 planned full-time equivalents |
2023–2024 planned full-time equivalents |
|---|---|---|---|---|---|---|
| Develop Quebec’s economy | 180 | 189 | 195 | 213 | 206 | 181 |
| Internal services | 154 | 170 | 175 | 180 | 178 | 157 |
| Total | 334 | 359 | 370 | 393 | 384 | 338 |
Expenditures by vote
For information on CED’s organizational voted and statutory expenditures, consult the Public Accounts of Canada 2021Footnote 17.
Government of Canada spending and activities
Information on the alignment of CED’s spending with Government of Canada’s spending and activities is available in GC InfoBaseFootnote 18.
Financial statements and financial statements highlights
Financial statements
CED’s financial statements (unaudited) for the year ended March 31, 2022, are available on the departmental websiteFootnote 19.
Financial statement highlights
| Financial information | 2021–2022 planned results |
2021–2022 actual results |
2020–2021 actual results |
Difference (2021–2022 actual results minus 2021-2022 planned results) | Difference (2021–2022 actual results minus 2020-2021 actual results) |
|---|---|---|---|---|---|
| Total expenses | 233,081,000 | 283,543,785 | 377,088,500 | 50,462,785 | (93,544,715) |
| Total revenue | 0 | 0 | 0 | 0 | 0 |
| Net cost of operations before government funding and transfers | 233,081,000 | 283,543,785 | 377,088,500 | 50,462,785 | (93,544,715) |
Expenses
- In 2021–2022, CED’s total expenses amounted to $283.5M, down $93.5M from the previous year. This 24.8% decline is primarily attributable to the decrease in transfer payments. RRRF spending in 2020–2021 was much higher than in 2021–2022.
- Transfer payment expenses, which amounted to $224.7M, fell by 30.3% between 20202021 and 2021–2022. Operating expenses stood at $58.9M, a year-over-year increase of 7.8%.
- The $50.5M variance with projected net expenses is mainly due to fact that transfer payments were higher than originally forecast.
Revenue
- CED’s revenue, returned to the Consolidated Revenue Fund, is declared in its financial statements as having been earned on behalf of the government. As a result, the organization’s total net revenue is zero. Revenue consists mainly of interest charged on payments in default.
| Financial information | 2021–2022 | 2020–2021 | Difference (2021–2022 minus 2020–2021) |
|---|---|---|---|
| Total net liabilities | 25,412,298 | 33,945,512 | (8,533,214) |
| Total net financial assets | 20,972,577 | 29,401,180 | (8,428,603) |
| Departmental net debt | 4,439,721 | 4,544,332 | (104,611) |
| Total non-financial assets | 3,359,146 | 3,074,731 | 284,415 |
| Departmental net financial position | (1,080,575) | (1,469,601) | 389,026 |
Liabilities
- As at March 31, 2022, CED’s net liabilities stood at $25.4M, down 25.1% from 2020–2021. This decrease is primarily due to the decline in net accounts payable and accrued liabilities, which accounted for 82.4% ($20.9M) of total net liabilities.
- Vacation pay and compensatory leave, along with future fringe benefits, accounted for 13.7% ($3.5M) and 3.8% ($1M) of the organization’s net liabilities, respectively.
Assets
- As at March 31, 2022, net financial assets stood at $21M, down 28.7% from the previous year’s total. This decrease is mainly attributable to the decline in amounts due from the Consolidated Revenue Fund to discharge liabilities (fringe benefits and accrued liabilities), which were also down.
- CED’s non-financial assets stood at $3.4M as at March 31, 2022, a year-over-year increase of 9.3%. This rise is primarily the result of the increase in prepaid expenses.
The 2021–22 planned results information is provided in CED’s Future-Oriented Statement of OperationsFootnote 20 and Notes 2021–22.
Corporate information
Organizational profile
Appropriate minister: The Honourable Pascale St-Onge
Institutional head: Manon Brassard
Ministerial portfolio: N/A
Enabling instrument: Economic Development Agency of Canada for the Regions of Quebec ActFootnote 21
Year of incorporation / commencement: 2005
Raison d’être, mandate and role: who we are and what we do
“Raison d’être, mandate and role: who we are and what we do” is available on CED’s website.Footnote 22
For more information on the department’s organizational mandate letter commitments, see the Minister’s mandate letter.Footnote 23
Operating context
Information on the operating context is available on CED’s website.Footnote 24
Reporting framework
CED’s Departmental Results Framework and Program Inventory of record for 2021–22 are shown below.
| Departmental results Framework | Core Responsibility: Economic Development in Quebec | Internal Services | |
|---|---|---|---|
| Departmental Result: Businesses are innovative and growing in Quebec | Indicator: Number of high growth firms in Quebec | ||
| Indicator: Value of exports of good (in dollars) from Quebec | |||
| Indicator: Value of exports of clean technologies (in dollars) from Quebec | |||
| Indicator: Revenue growth rate of firms supported by CED programs | |||
| Departmental Result: Communities are economically diversified in Quebec | Indicator: Percentage of SMEs that are majority-owned by women, Indigenous people, youth, visible minorities and persons with disabilities in Quebec | ||
| Indicator: Percentage of professional, science and technology-related jobs in Quebec’s economy | |||
| Indicator: Amount leverage per dollar invested by CED in community projects | |||
| Departmental Result: Businesses invest in the development and commercialization of innovative technologies in Quebec | Indicator: Value of Business Expenditure in Research and Development (BERD) by firms receiving CED program funding (in dollars) | ||
| Indicator: Percentage of companies engaged in collaborations with higher education institutions in Quebec | |||
| Program Inventory | Program: Regional Innovation | ||
| Program: Community economic development and diversification | |||
| Program: Targeted transition support | |||
Supporting information on the program inventory
Financial, human resources and performance information for CED’s Program Inventory is available in GC InfoBase.Footnote 25
Supplementary information tables
The following supplementary information tables are available on CED’s website:
- Details on transfer payment programs
- Gender-based analysis plus
- Response to parliamentary committees and external audits
- United Nations 2030 Agenda for Sustainable Development and the Sustainable Development Goals
Federal tax expenditures
The tax system can be used to achieve public policy objectives through the application of special measures such as low tax rates, exemptions, deductions, deferrals and credits. The Department of Finance Canada publishes cost estimates and projections for these measures each year in the Report on Federal Tax ExpendituresFootnote 26. This report also provides detailed background information on tax expenditures, including descriptions, objectives, historical information and references to related federal spending programs as well as evaluations and GBA Plus of tax expenditures.
Organizational contact information
Mailing address:
Canada Economic Development for Quebec Regions
800 René-Lévesque West BLVD., Suite 500
Montréal (Québec) H3B 1X
Telephone: 514-283-6412
Fax: 514-283-3302
Website(s): www.ced.canada.ca
Appendix: definitions
appropriation (crédit)
Any authority of Parliament to pay money out of the Consolidated Revenue Fund.
budgetary expenditures (dépenses budgétaires)
Operating and capital expenditures; transfer payments to other levels of government, organizations or individuals; and payments to Crown corporations.
core responsibility (responsabilité essentielle)
An enduring function or role performed by a department. The intentions of the department with respect to a core responsibility are reflected in one or more related departmental results that the department seeks to contribute to or influence.
Departmental Plan (plan ministériel)
A report on the plans and expected performance of an appropriated department over a 3‑year period. Departmental Plans are usually tabled in Parliament each spring.
departmental priority (priorité ministérielle)
A plan or project that a department has chosen to focus and report on during the planning period. Priorities represent the things that are most important or what must be done first to support the achievement of the desired departmental results.
departmental result (résultat ministériel)
A consequence or outcome that a department seeks to achieve. A departmental result is often outside departments’ immediate control, but it should be influenced by program-level outcomes.
departmental result indicator (indicateur de résultat ministériel)
A quantitative measure of progress on a departmental result.
departmental results framework (cadre ministériel des résultats)
A framework that connects the department’s core responsibilities to its departmental results and departmental result indicators.
Departmental Results Report (rapport sur les résultats ministériels)
A report on a department’s actual accomplishments against the plans, priorities and expected results set out in the corresponding Departmental Plan.
experimentation (expérimentation)
The conducting of activities that seek to first explore, then test and compare the effects and impacts of policies and interventions in order to inform evidence-based decision-making, and improve outcomes for Canadians, by learning what works, for whom and in what circumstances. Experimentation is related to, but distinct from innovation (the trying of new things), because it involves a rigorous comparison of results. For example, using a new website to communicate with Canadians can be an innovation; systematically testing the new website against existing outreach tools or an old website to see which one leads to more engagement, is experimentation.
full-time equivalent (équivalent temps plein)
A measure of the extent to which an employee represents a full person‑year charge against a departmental budget. For a particular position, the full‑time equivalent figure is the ratio of number of hours the person actually works divided by the standard number of hours set out in the person’s collective agreement.
gender-based analysis plus (GBA Plus) (analyse comparative entre les sexes plus [ACS Plus])
An analytical tool used to support the development of responsive and inclusive policies, programs and other initiatives; and understand how factors such as sex, race, national and ethnic origin, Indigenous origin or identity, age, sexual orientation, socio-economic conditions, geography, culture and disability, impact experiences and outcomes, and can affect access to and experience of government programs.
government-wide priorities (priorités pangouvernementales)
For the purpose of the 2021–22 Departmental Results Report, government-wide priorities refers to those high-level themes outlining the government’s agenda in the 2020 Speech from the Throne, namely: Protecting Canadians from COVID-19; Helping Canadians through the pandemic; Building back better – a resiliency agenda for the middle class; The Canada we’re fighting for.
horizontal initiative (initiative horizontale)
An initiative where two or more federal organizations are given funding to pursue a shared outcome, often linked to a government priority.
non-budgetary expenditures (dépenses non budgétaires)
Net outlays and receipts related to loans, investments and advances, which change the composition of the financial assets of the Government of Canada.
performance (rendement)
What an organization did with its resources to achieve its results, how well those results compare to what the organization intended to achieve, and how well lessons learned have been identified.
performance indicator (indicateur de rendement)
A qualitative or quantitative means of measuring an output or outcome, with the intention of gauging the performance of an organization, program, policy or initiative respecting expected results.
performance reporting (production de rapports sur le rendement)
The process of communicating evidence‑based performance information. Performance reporting supports decision making, accountability and transparency.
plan (plan)
The articulation of strategic choices, which provides information on how an organization intends to achieve its priorities and associated results. Generally, a plan will explain the logic behind the strategies chosen and tend to focus on actions that lead to the expected result.
planned spending (dépenses prévues)
For Departmental Plans and Departmental Results Reports, planned spending refers to those amounts presented in Main Estimates.
A department is expected to be aware of the authorities that it has sought and received. The determination of planned spending is a departmental responsibility, and departments must be able to defend the expenditure and accrual numbers presented in their Departmental Plans and Departmental Results Reports.
program (programme)
Individual or groups of services, activities or combinations thereof that are managed together within the department and focus on a specific set of outputs, outcomes or service levels.
program inventory (répertoire des programmes)
Identifies all the department’s programs and describes how resources are organized to contribute to the department’s core responsibilities and results.
result (résultat)
A consequence attributed, in part, to an organization, policy, program or initiative. Results are not within the control of a single organization, policy, program or initiative; instead they are within the area of the organization’s influence.
statutory expenditures (dépenses législatives)
Expenditures that Parliament has approved through legislation other than appropriation acts. The legislation sets out the purpose of the expenditures and the terms and conditions under which they may be made.
target (cible)
A measurable performance or success level that an organization, program or initiative plans to achieve within a specified time period. Targets can be either quantitative or qualitative.
voted expenditures (dépenses votées)
Expenditures that Parliament approves annually through an appropriation act. The vote wording becomes the governing conditions under which these expenditures may be made.