2022-2023 Departmental Results Report
Download the printer-friendly version (PDF)About this publication
Publication author : Canada Economic Development for Quebec Regions
Catalogue: Iu90-1/16E-PDF
ISSN: 2561-0015
Publish date: November 9, 2023
Summary: This report deals with Canada Economic Development's principal achievements in regards to its engagements towards the Parliament.
Table of Contents
From the Minister
I am pleased to present the Departmental Results Report for Canada Economic Development for Quebec Regions (CED) for 2022–23.
This report attests to the actions undertaken by CED and highlights the achievements of the past year. In accordance with the Government of Canada’s priorities, our intervention efforts have focused on short- and long-term economic recovery in the regions of Quebec to foster a sustainable and inclusive recovery. To that end, investments totalling $491.6M were made, and 1,325 projects were completed. Ultimately, these projects could generate a total investment of $5.8B.
The objective was to support all of Quebec's regions, targeting crucial sectors and their economic ecosystems through funding programs, services, knowledge and expertise tailored to diverse realities.
We have worked closely with our partners, the other regional development agencies across Canada and the various stakeholders on the ground. We have adjusted our offering to reflect the changing economy and challenges faced by our SMEs and our regions, whether it be to support the post-pandemic recovery of the tourism sector, to support the aerospace sector, or to help the regions affected by Hurricane Fiona.
I am proud of CED’s ongoing commitment to green innovation and growth, a commitment that has led our teams to work hand in hand with businesses, partners and key stakeholders in the economic ecosystem to accelerate the green shift for our SMEs and our regions.
In 2022–23, CED continued to stand out by its presence in the Quebec regions and its support for SMEs and communities so they can be fully involved in a prosperous, and sustainable economy that benefits everyone.
Happy reading!

The Honourable Soraya Martinez Ferrada
Minister of Tourism and Minister responsible for the
Economic Development Agency of Canada for the
Regions of Quebec
Results at a glance
The year 2022 was marked by trends with mixed impacts on the Quebec economy. Like most major economies, Quebec faced inflationary pressure and significant monetary tightening in response to it. The resulting uncertain economic outlooks were reflected in weak investment, particularly by businesses, and trade, two factors that limited growth. On the other hand, the strength of the Quebec labour market helped support household consumer spending, a major contributor to GDP growth. Finally, the slowdown was less severe than anticipated and the recession that was expected in 2022 did not materialize.
In addition, several structural issues have persisted and continue to hinder Quebec’s economic potential, particularly productivity delays, labour shortages and a decline in entrepreneurial intensity.
Assistance from Canada Economic Development for Quebec Regions (CED) is thus intended to support regional economies and small and medium enterprises (SMEs) in Quebec and to respond to the structural and conjunctural challenges.
Of a total budget of $544.1M, we invested $491.6M in 1,325 grant and contribution (G&C) projects. Ultimately, those projects could generate total investments of $5.8B.
| Funds used (actual expenditures) | Personnel (full-time equivalents [FTEs]) |
|---|---|
| $544,114,720 | 380 |
Our priorities
In line with our departmental planning and in response to the economic context described above, one priority particularly guided our intervention efforts in 2022–23:
Support the short- and long-term economic recovery of Quebec’s regions, thereby contributing to a sustainable and favourable recovery for all
In the past fiscal year, CED supported all regions in Quebec, including many rural communities, by providing funding programs, services, knowledge and expertise tailored to the different regional realities in Quebec so they could take part in the transition to a more resilient, sustainable and inclusive economy. In addition to its regular programming, CED continued to deliver its five pan‑Canadian economic recovery initiatives announced in Budget 2021 that, in 2022–23, allowed for the completion of 575 projects through financial assistance totalling $220.3M. Those five initiatives are:
- Jobs and Growth Fund (JGF): $58.9M invested in 82 projects
- Aerospace Regional Recovery Initiative (ARRI): $13.2M invested in 17 projects
- Tourism Relief Fund (TRF): $90.8M invested in 280 projects
- Major Festivals and Events Support Initiative (MFESI): $21.2M invested in 8 projects
- Canada Community Revitalization Fund (CCRF): $36.3M invested in 188 projects
In addition to these initiatives, the Hurricane Fiona Recovery Fund was created in early 2023 in cooperation with the Atlantic Canada Opportunities Agency (ACOA) to contribute to recovery efforts and economic recovery in communities in Eastern Canada directly affected by the storm, and to promote adaptation and resilience to climate change.
Sustainable growth is also a central element of CED’s interventions, in line with Government of Canada priorities. Over the past year, CED has invested $58M, including $36.8M though temporary initiatives, in 127 projects aimed at, among other things, improving the environmental performance of businesses and communities, particularly by adopting green technologies or developing technologies to reduce environmental impacts.
Thus, the initiatives associated with our main priority, to support the short- and long‑term economic recovery of Quebec’s regions, thus contributing to a sustainable and favourable economy for all, as well as the parallel interventions implemented by CED in 2022–23, all contributed to varying degrees and in a complementary manner to progress toward achieving our departmental results presented in the next section.
For more information on the plans, priorities and results achieved by CED, see the “Results: what we achieved” section of this report.
Results: what we achieved
Core responsibilities
Developing Quebec’s economy
Description
Support economic growth, job creation and economic prosperity in Quebec through clean and inclusive growth; help SMEs to grow through trade and innovation; build on regional competitive strengths.
Results
CED and the other six RDAs work together to contribute – under their respective mandates – to the economic development of Canada’s regions.
To measure progress toward fulfilling its core responsibility, CED seeks to contribute to and influence the following three departmental results. Achieving these results is dependent on several factors and CED’s interventions contributes to them, in accordance with its budgets. The results achieved in 2022-23 show our ongoing commitment to innovation, digital competitiveness, green growth and economic diversification and resilience across all our regions. We have continued to monitor the uncertain economic situation and adjust our service offer to our clients in implementing their projects so Quebec businesses and communities can overcome the current challenges.
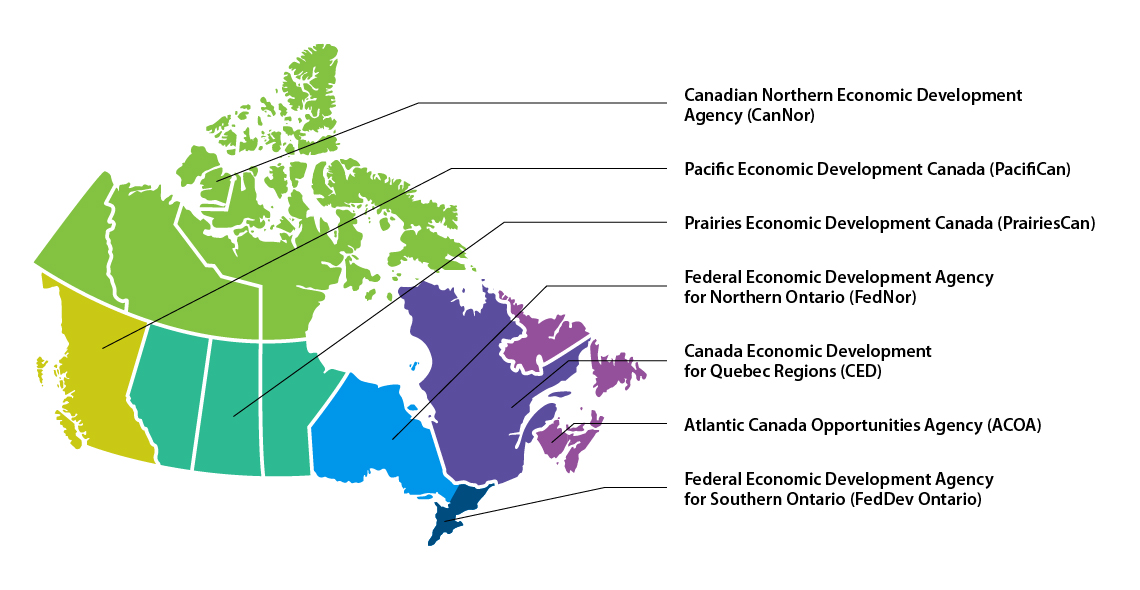
Text version of Regional representation
| Province/Territory | Regional development agency support |
|---|---|
| Alberta | Prairies Economic Development Canada (PrairiesCan) |
| British Columbia | Pacific Economic Development Canada (PacifiCan) |
| Manitoba | Prairies Economic Development Canada (PrairiesCan) |
| New Brunswick | Atlantic Canada Opportunities Agency (ACOA) |
| Newfoundland and Labrador | Atlantic Canada Opportunities Agency (ACOA) |
| Northwest Territories | Canadian Northern Economic Development Agency (CanNor) |
| Nova Scotia | Atlantic Canada Opportunities Agency (ACOA) |
| Nunavut | Canadian Northern Economic Development Agency (CanNor) |
| Ontario | Northern Ontario: Federal Economic Development Agency for Northern Ontario (FedNor) Southern Ontario: Federal Economic Development Agency for Southern Ontario (FedDev Ontario) |
| Prince Edward Island | Atlantic Canada Opportunities Agency (ACOA) |
| Quebec | Canada Economic Development for Quebec Regions (CED) |
| Saskatchewan | Prairies Economic Development Canada (PrairiesCan) |
| Yukon | Canadian Northern Economic Development Agency (CanNor) |
Departmental result 1: Quebec businesses are innovative and growing
With rising interest rates and inflation leading to weak investment, particularly by businesses, the post-pandemic context offered no respite for Quebec SMEs. This is why enhancing their innovation capabilities was essential to their competitive position while at the same time fostering a sustainable and inclusive recovery. Business growth and innovation has therefore remained the main objective of CED’s Regional Economic Growth through Innovation (REGI) programFootnote 1. That support resulted in investments of $212.8M in 589 projects, conducted by SMEs or NPOs with a mandate to support SMEs. Those projects included the development of new goods and services, the stimulation of local manufacturing and strengthening of supply chains, cybersecurity and e-commerce support, the acceleration of the digital shift, or a better positioning on foreign markets (always in accordance with applicable international agreements).
Example of an innovation project
Where: Thurso, served by the Outaouais Business Office (BO)
Who: Nanotech Security Corp., a major exporter that manufactures protective film for paper currency and nanotechnology-based branding.
What: The $2M in assistance is for the acquisition of digital equipment and upgrading of the company’s facilities that will foster its growth.
Example of a productivity project
Where: St-Justine, served by the Québec-Chaudières-Appalaches BO
Who: Rotobec inc., a manufacturing company specializing in the design and manufacturing of industrial handling equipment, including for the forestry, rail and steel recycling industries.
What: The $2.2M in assistance is for the acquisition of state-of-the-art digital production equipment that will help the company meet its objectives of reducing waste, atmospheric pollutants and energy use.
The year 2022–23 was also a landmark year for CED’s efforts to support the environmental transition of Quebec businesses and regions. First, through its regular programs and stimulus initiatives, CED has invested $58M in over 127 projects supporting the environmental transitionFootnote 2, the highest level since this data was available. In addition to their impact on the economic development of their region, these projects allow SMEs to develop or adopt clean technologies, or to modify their business practices with a view to sustainable growth, for example by reducing greenhouse gases, producing goods that pollute less, expanding bioenergy, alternative energies and electric vehicles, or improving energy efficiency. This increased focus on supporting CED’s clients in accelerating the adoption of more sustainable business models is one of the two priorities set out in CED’s 2023–2024 Departmental Plan.
Accelerate the green transition
CED is determined to further support the green transition of SMEs and regional economies by prioritizing strategic investments in clean technologies, organizations that integrate environmentally responsible practices into their operations and regional ecosystems that support SMEs in taking action.
Example of a project – Green Shift
Where: Sherbrooke, served by the Eastern Townships BO
Who: 9351-0618 Québec Inc. – Calogy Solutions, a startup business that offers innovative thermal management solutions for Li-ion batteries used in electric transportation, including in the aviation industry.
What: The $1.4M in assistance will support the development, certification and marketing of a product that will help the aerospace industry make its operations more environmentally friendly and adopt environmentally sustainable practices.
CED contributes to the creation of an entrepreneurial environment conducive to innovation and promotes the startup and growth of technological and innovative businesses by supporting stakeholders in the regional innovation ecosystems. In 2022–23, CED supported 21 accelerator-incubator projects through investments totalling over $7M.
Example of a project – Accelerators and incubators
Where: Montréal, served by the Greater Montréal BO
Who: Esplanade Montréal, conducted in collaboration with Espace-Entrepreneur, Développement économique de l'agglomération de Longueuil and the Mouvement des accélérateurs d'innovation du Québec, businesses accelerated through this project will have access to entrepreneurship to resolve social, environmental and economic issues.
What: The $1.5M in assistance is used to structure and deploy a support model for impact enterprises in several communities in Quebec that are not served by an accelerator.
The pandemic created a climate of change that was conducive to innovation and the adoption of technology for many businesses, which had to adapt to remote work, e-commerce, supply problems, adjustments to distribution networks or distancing measures. Through the JGF, a temporary national fund, CED helped businesses and the organizations that support them to strengthen their resilience and grow. This initiative therefore supported SMEs in finding and adopting new methods and technologies to foster their growth. This fund financed 82 projects with total assistance of nearly $59M to improve the competitiveness of businesses, create jobs and support SMEs in a green and inclusive environment.
Example of a project funded through the JGF
Where: Alma, served by the Saguenay–Lac-St-Jean BO
Who: Collectes Coderr, a social economy enterprise with multiple activities, including the disassembly and recycling of end-of-life small refrigeration appliances.
What: The $2.8M in assistance is for the expansion of facilities and the acquisition of equipment to increase the business’s productivity and processing capacity.
In the past year, CED also made sustained efforts to raise awareness among SMEs and research centres in Quebec about the opportunities generated by the Industrial and Technological Benefits (ITB) PolicyFootnote 3. CED organized a webinar to help businesses that want to understand NATO procurement mechanisms, attended by over 200 people. We also helped organize the seventh Symposium on the Canadian Defence and Security Market in Quebec, which brought together nearly 300 participants, including prime contractors, SMEs, the main industry partners in Quebec and several federal representatives. CED also supported many SMEs at defence and security industry events to help them learn about potential opportunities and benefits in that sector.
Departmental result 2: Communities are economically diversified in Quebec
Economic recovery was CED’s focus over the past year, with several key sectors of Quebec’s local and regional economies being supported, in particular through assistance to communities in their recovery efforts and the diversification of their activities. To this end, the leverage for community projects supported by CED this year reached $2.91M, a level higher than the previous two years. This increase in leverage reflects a return to the essential participation of many partners in project funding arrangements, allowing CED to support a greater number of projects that benefit communities or sectors in need.
We also continued to support SMEs in all regions of Quebec through funding to organizations that help them. This includes the 57 Community Futures (CFs), the 8 Business Development Centres (BDCs) and the network of CFs and BDCs. The $33.1M of financial assistance invested through the Community Futures Program (CFP)Footnote 4 helped those organizations support local projects and pursue their mission of supporting economic development in rural regions.
These investments are consistent with CED’s approach, which focuses on local opportunities while taking into account the diversity of regional realities. In keeping with its mandate to diversify the economy of Quebec’s regions, CED promotes investments that have direct benefits for communities, including access to regional markets, the development or upgrading of infrastructure, and the development of regional anchor sectors such as tourism.
Example of a tourism project
Where: Multiple regions
Who: Indigenous Tourism Quebec, a sector tourism association that helps Indigenous tourism businesses from the 11 Nations in Quebec to develop and improve their business practices and their position on tourism markets.
What: The $810k in assistance is to develop Indigenous tourism destinations in accordance with environmentally friendly practices so communities can benefit from post-pandemic market opportunities.
In addition to intervening to increase the vitality of the regions through our regular programs – including the Quebec Economic Development Program (QEDP)Footnote 5, responsible for funding 129 projects for a total of $55M, and the CFP – we implemented several complementary initiatives to help communities recover from the pandemic.
Tourism Relief Fund (TRF): $90.8M invested in 280 projects
The tourism sector has been among the hardest hit by the COVID-19 pandemic, due mainly to public health measures and restrictions on movement and travel. The TRF supported tourism businesses and regional tourism organizations to adapt their operations to meet public health requirements while investing in goods and services to facilitate their future growth.
Example of a project funded through the TRF
Where: Mistissini, served by the Abitibi-Témiscamingue-Nord-du-Québec BO
Who: The Nibiischii Corporation, a Cree Nation organization with a mandate of administering the activities of the Albanel-Mistassini-and-Waconichi Wildlife Reserve.
What: The $1M in assistance includes improving housing units and the conference room at a tourism establishment to make it operational throughout the year.
Major Festivals and Events Support Initiative (MFESI): $21.2M invested in 8 projects
Major festivals and events are important drivers of economic activity and tourism appeal. Through the MFESI, CED helped major festivals and events with revenues over $10M to adapt and enhance their activities in a context of economic recovery and to position themselves for the future. The MFESI supported major festivals affected by the pandemic and helped them not only remain operational and adapt their activities but also to better position themselves for economic recovery and growth.
Example of a project funded through the MFESI
Where: Québec City, served by the Québec-Chaudières-Appalaches BO
Who: Carnaval de Québec inc., an NPO responsible for organizing this world-renowned winter celebration.
What: The $3.06M in assistance included the acquisition of a heated stage set up under a new dome and the development of immersive experiences, including a multisensory winter village to allow visitors to experience the Carnival in the middle of summer to encourage them to return in the winter to experience the real sensations.
Canada Community Revitalization Fund (CCRF): $36.3M invested in 188 projects
The CCRF helped many communities throughout Quebec to carry out and improve community facility projects so they can recover from the effects of the COVID-19 pandemic. The funding granted over the past year helped support NPOs, municipalities, public institutions and Indigenous communities in carrying out projects aimed, among other things, at revitalizing downtowns and main streets, reinventing outdoor spaces, creating green spaces and increasing access to community spaces.
Example of a project funded through the CCRF
Where: Plessisville, served by the Centre-du-Québec BO
Who: The Organisme de récupération anti-pauvreté de l'Érable (ORAPÉ), offers, among other things, assistance to low-income families and support for work integration in the L’Érable RCM.
What: The $106k in assistance helped establish the Espace de l’alimentation in Plessisville. This multifunctional space will be used to offer food services to families in the region and for presenting culinary workshops
In addition to these post-pandemic economic recovery initiatives, CED also helped regions directly affected by Hurricane Fiona in Eastern Canada. Specifically, the Hurricane Fiona Recovery Fund was created at the beginning of 2023 to support communities, businesses and organizations in assessing storm damage, planning the recovery of community and business assets and the reconstruction of infrastructure, thus fostering adaptation and resilience to climate change. Delivery from the Fund continues in 2023–24.
Inclusive economy
In addition to addressing disparities in recovery between the various communities in Quebec, CED pursued the following initiatives to foster an inclusive economy in all regions of Quebec:
- Women Entrepreneurship Strategy (WES) – Ecosystem Fund: $4.3M invested in 7 projects with NPOs to address gaps in services and strengthen their ability to support businesses in the female entrepreneurship ecosystem, including by offering women entrepreneurs access to training, networking, mentoring and business development and growth strategies that improve their delivery of services or their productivity.
- Economic Development Initiative – Official Languages (EDI-OL): $1.9M invested in 12 projects with NPOs to foster economic development in official language minority communities (OLMCs) through various activities, including innovation, entrepreneurship, partnerships and diversification of economic activities.
- Black Entrepreneurship Program (BEP) – Ecosystem Fund: $6.1M invested in 10 projects conducted with business associations led by members of the Black community to help them develop new services or expand those already offered, such as mentoring, networking, financial planning and business management support for entrepreneurs from Black communities.
- TRF – Indigenous communities: As part of the TRF, a minimum of 10% of the total national envelope was specifically dedicated to Indigenous tourism initiatives by RDAs. For 2022–23, CED invested $6.2M in 29 Indigenous projects.
- Quebec’s strategic green initiative – Energy transition for Indigenous businesses: Since 2022, CED has jointly administered this initiative with Indigenous Services Canada to support Indigenous communities in seizing economic development opportunities related to the growth of the green energy sector and to take part in the energy transition in Quebec. As part of the Government of Canada’s Strategic Partnerships Initiative, it supported 17 projects in 2022–23 for a total of $4.08M in government contributions.
The gender-based analysis section of this report and the Supplementary Information Table include additional information on our interventions to promote the economic participation of represented groups in the regions of Quebec.
Example of a Project supported by the BEP
Where: Multiple regions
Who: Group 3737, an entrepreneurial organization that supports projects by entrepreneurs from immigrant, diverse, inclusive and Black communities.
What: The nearly $5M in assistance allows the organization to enhance its activities and to offer specialized support services to Francophone entrepreneurs from the Black community for three years.
Example of a project to support OLMCs
Where: Îles-de-la-Madeleine, served by the Gaspésie-Îles-de-la-Madeleine BO
Who: Council for Anglophone Magdalen Islanders (CAMI), a non-profit organization dedicated to promoting and protecting the rights of English-speaking residents of the Îles‑de‑la‑Madeleine.
What: The $865,626 in assistance contributes to the conversion of a former school building into a multi-functional facility that integrates tourism and community functions, thus revitalizing the social and economic potential of the English-speaking minority community living on Île‑d’Entrée.
Departmental result 3: Businesses invest in the development and commercialization of innovative technology in Quebec
In 2022–23, CED continued to support businesses that develop and commercialize innovations. Under the REGI, we invested $12.0M in 76 commercialization projects.
Example of a commercialization project
Where: Rimouski, served by Bas-Saint-Laurent BO
Who: Nosotech inc., a business specializing in the development of infectious disease prevention software.
What: The $200k in assistance enables the SME to implement a commercialization strategy for new markets.
Example of a project with an ORPEX
Where: Lanaudière, served by the Mauricie BO
Who: Société de développement international de Lanaudière (SODIL), an organization dedicated to supporting SMEs in the region in their export efforts.
What: Over three years, the $411k in assistance covers the operations of this regional export promotion organization (ORPEX), which offers consulting services and support for SMEs in their efforts to develop and diversity export markets.
CED also invested nearly $51.1M in 130 separate projects led by 109 organizations that contribute to the technical, technological and business advancement of SMEs in Quebec. Intended to improve the competitiveness of businesses by developing and transferring technological innovation, these NPOs support companies in their business projects, including the adoption, adaptation and commercialization of technologies that improve their productivity and accelerate their growth.
Example of projects with a centre for technology transfer
Where: Sept-Îles, served by the Côte-Nord BO
Who: CÉGEP de Sept-îles, an educational institution that plays a key role on the North Shore in innovation and technology transfer, particularly in predictive maintenance with the value chain of major mining contractors and the network of SMEs that surround them.
What: The $10M in assistance includes the acquisition of test benches and the construction of an incubation building.
Cybersecurity is also a growing challenge for businesses and organizations. In an economy that is increasingly dependent on technology, cybersecurity is essential to the sustainability and development of businesses and the organizations that support them. Raising their awareness of this threat and measures that can be put in place to prevent and counter attacks is important. It is with this in mind that CED discusses the level of cybersecurity maturity with each financial assistance applicant. All advisors have been trained to have this discussion and to raise client awareness about cybersecurity risks. This approach also allows CED to obtain a more representative picture of the level of client preparedness for cybersecurity issues.
Aerospace Regional Recovery Initiative (ARRI): $13.2M invested in 17 projects
The COVID-19 pandemic hit the aerospace industry hard, affected by the reduction in demand from airlines, which gradually resumed operations in 2022. Recognizing the major role of the aerospace industry in the value of Quebec exports and the impact of the pandemic on this sector, CED is implementing the national ARRI program in Quebec, which was launched in June 2021. The ARRI has helped the Canadian and Quebec aerospace industries, particularly SMEs, emerge from the pandemic by strengthening their competitiveness on the world stage. Again this year, this program supported projects by businesses in the aerospace industry and organizations that support them to make their operations more environmentally friendly, to promote the adoption of environmentally sustainable practices, and to remain at the cutting edge of technology. Thus, through the ARRI, CED has supported businesses that adopt clean technologies and make their operations environmentally friendly, while encouraging their commercialization and export.
Example of a project funded through the ARRI
Where: Saint-Étienne-des-Grès, served by the Mauricie BO
Who: SDP Autosport Inc., a manufacturer of complex custom metal parts, primarily for the aerospace industry.
What: The $185k in assistance is primarily for the acquisition of a five-axis machining centre that will allow it to improve its productivity and production capacity, and to develop new markets.
As part of the National Quantum Strategy (NQS), CED delivers regional quantum innovation (RQI) in Quebec, a component of the Commercialization pillar of the strategy. Through RQI, launched in 2022–23, CED will ultimately invest $22.16M to allow businesses in Quebec to expand and commercialize quantum technologies through the main regional hubs of quantum expertise. Quantum technology will transform key sectors of our economy, such as: computing (algorithms and quantum simulations, etc.); communications and cybersecurity (cryptography, encryption, etc.); detection (sensors, atomic clocks, quantum compasses, etc.); imaging (e.g. medical and thermal imaging) and the development of innovative materials (micro-manufacturing, materials with new quantum properties, etc.).
Gender-based analysis plus
CED continues to implement its organizational governance policy and framework concerning gender-based analysis plus (GBA+) to increase the consideration of gender and diversity in the development of policies, programs, internal practices and client services. Since the implementation of this policy in 2018, the organization's maturity on GBA+ issues and analyses has led to a better understanding of the realities and barriers for the socioeconomic participation of certain groups or regions, particularly in the technology and manufacturing sectors supported by CED. These efforts have helped find ways to measure the impacts of its initiatives and to explore how certain practices could be implemented to support inclusive growth throughout the regions of Quebec.
Since November 2022, all CED clients have been invited to declare their organizational equity, diversity and inclusion (EDI) practices. More specifically, CED assistance application forms now include questions to understand how our clients consider EDI elements in their business model and approaches. To equip, educate and encourage clients to adopt EDI practices with a view to economic growth and organizational resilience, CED has made new EDI tools available on its website. CED is proud to be the first regional development agency to have adopted this new approach.
We have also integrated GBA+ into the policy and program design and implementation for two initiatives. First, to establish an International Sustainability Standards Board centre in Montréal, GBA+ provided an understanding of the organizational and hiring practices that will be implemented by the Centre to promote the economic participation of people from under‑represented groups. Then, for the Hurricane Fiona Recovery Fund, new GBA+ performance measurement indicators were integrated to ensure that the initiative supports Indigenous, rural and remote communities or beneficiaries.
Finally, to improve the ability to report on the repercussions of GBA+ on its programs and initiatives, CED works with the supported intermediary groups to improve the reliability of data collected concerning their clients. As such, in 2022–23, CED began reviewing the annual data collection tools used by the intermediary groups it supports, particularly to integrate the new categories and definitions of under-represented groups introduced in 2021, namely women, youth, Indigenous peoples, newcomers to Canada and immigrants, persons with disabilities, members of OLMCs, Black communities, racialized communities and 2SLGBTQI+ communities. The implementation of these new tools will begin gradually in 2023–24.
GBA+: New operational practices in 2022–23 to better reflect the diversity of our clients’ needs
- A client approach to equity, diversity and inclusion (EDI): In November 2022, CED deployed a new approach applicable to all its clients and programs – an approach that stems from the findings of GBA+ completed by CED:
- Client resources: Raise awareness among SMEs and organizations about the competitive benefits of EDI and better equip them in that respect: EDI: Levers for Your GrowthFootnote 6 and How to Create an EDI PlanFootnote 7.
- New form for understanding EDI practices: Of the first 83 SMEs and NPOs that completed the form, 37 (44.6%) indicated that there would be an EDI component in their organizational practices or that they intended to begin such efforts.
- More inclusive tourism in Quebec: As part of the design of the delivery of tourism initiatives by NPO clients, CED began work to identify inclusive tourism as a priority. This could be reflected in their awareness activities and support for tourism businesses so their services, goods and offerings reflect and take into account the various needs of Quebec’s population and regions.
- The Inuit Nunangat Policy: Indigenous economic reconciliation is a priority for CED, which, since 2018, has made some of its programs more flexible for Indigenous clients to facilitate access to available funding and intensify its interventions with their communities. With the coming into force of the Inuit Nunangat Policy in 2022, the flexibilities will be adjusted to take into account the specific reality of the Inuit.
- EDI and regional economic development: To contribute to reflections on advancing its GBA+ and EDI policies, CED has begun a research collaboration with the Max Bell School at McGill University. As part of the Public Policy Lab project, four students are exploring how the various regional economic development models that incorporate EDI principles could contribute to innovation and growth in the regions of Quebec.
GBA+: 2022–23 investment highlights
- SME investments: $34.3M invested in 161 projects by SMEs with majority owners from under-represented groups, representing 22.1% and 27.1% of all investments and projects respectively.
- NPO investments: $156.7M invested in 379 projects by NPOs led or predominantly led by individuals from under-represented groups, representing 46.6% and 51.8% of all investments and projects respectively
- Of the abovementioned amounts, the following is the distribution of investments broken down by the nine categories of under-represented groups identified by CED. The definitions can be found on our websiteFootnote 8 and the amounts below must not be added, as clients may self-declare as being in more than one group:
- 2SLGBTQI+: 9 SME projects ($1.2M) and 26 NPO projects ($28.7M)
- Indigenous: 18 SME projects ($7.6M) and 94 NPO projects ($30.5M)
- Women: 774 SME projects ($12.7M) and 319 NPO projects ($137.6M)
- Youth: 78 SME projects ($13.9M) and 197 NPO projects ($86.5M)
- Racialized communities: 9 SME projects ($1.1M) and 127 NPO projects ($77.8M)
- Black communities: 2 SME projects ($0.1M) and 22 NPO projects ($35.3M)
- OLMC: 8 SME projects ($1.9M) and 117 NPO projects ($70.4M)
- Newcomers to Canada and immigrants: 11 SME projects ($2.2M) and 20 NPO projects ($23.0M)
- Persons with disabilities: 3 SME projects ($0.2M) and 107 NPO projects ($63.1M)
Note that the measurement of the impact of GBA+ on CED projects and clients is based on data collected from clients when funding requests are received and analyzed, particularly through the voluntary self-reporting form on which clients can indicate their membership in an under-represented group. As a result, data gaps may occur if self-reporting is incomplete, inaccurate or insufficient. In addition, in the interest of continuous improvement, CED has begun and is pursuing work to validate its data collection methods and reporting procedures to ensure data quality.
For more information on CED’s intervention with respect to GBA+ and under-represented groups, see the Supplementary Information Table on gender-based analysis plusFootnote 9.
United Nations 2030 Agenda for Sustainable Development and the Sustainable Development Goals
For information on how CED advances the United Nations Sustainable Development Goals, see our Supplementary Information Table The 2030 Agenda for Sustainable Development and United Nations Sustainable Development GoalsFootnote 10 and the table Reporting on Green ProcurementFootnote 11.
Key risks
Risk 1: Information technology (IT) security
The COVID-19 crisis highlighted the dependency and risks associated with technological infrastructure and data protection. Public organizations are a prime target and hackers are becoming more and more creative in achieving their goal.
To mitigate these risks, there are monitoring measures and technological tools in place, in addition to continuous monitoring of critical applications. In 2022–23, CED continued to implement a new cybersecurity strategy, increased active system monitoring, expanded its vulnerability assessments and further raised employee awareness of cybersecurity issues.
Risk 2: Workforce health and well-being
Employees have faced a variety of changing factors that have affected workload and work methods. The record number of stimulus initiatives undertaken since 2021–22 has put pressure on the workforce, which was already mobilized to ensure delivery of regular business programs and activities. That pressure was exacerbated by pandemic fatigue and labour shortages in several job categories across the organization.
The return to hybrid workplaces also marked the work environment for our employees. In keeping with efforts to mitigate the negative impacts since the start of the COVID-19 crisis, CED has implemented a process and tools to facilitate that return. Flexibility was maintained for work schedules, based on team charters, to promote work-life balance. The organization also provided increased support through training for managers on facing the challenges of hybrid management and increased opportunities for communication and staff feedback. CED has also modernized its equipment and workspaces to provide an environment that is conducive to new work realities. We also continue to offer the services of an ombudsperson.
With respect to recruitment challenges, CED has made sustained efforts and better targeted its interventions to attract and retain a competent and diverse workforce. These efforts will continue over the coming year.
Risk 3: Program delivery
Like other RDAs, CED was called upon to deliver several initiatives to stimulate the economy following the COVID-19 pandemic and to mitigate its impacts as it continued to deliver its regular programs and monitor the emergency initiatives it had already delivered. CED’s programs were complemented by numerous federal and provincial government business assistance measures.
The multiple federal and provincial programs, each with different eligibility criteria and admissible costs, could have resulted in clients not fully accessing the assistance offered to them. To mitigate this risk, CED set up a specialized team to ensure a proper understanding of the new initiatives and to inform clients about them in a timely manner. Technical presentations were offered to clients and partners to clarify the criteria and terms of our programs.
Results achieved
The following table shows, for Developing Quebec’s economy, the departmental results achieved, the performance indicators, the targets and the target dates for 2022–23 and the actual results for the three most recent fiscal years for which results are available.
| Departmental results | Performance indicators | Target | Date to achieve target | 2020–21 actual results |
2021–22 actual results |
2022–23 actual results |
|---|---|---|---|---|---|---|
| R1: Businesses are innovative and growing in Quebec | Number of high-growth businesses in Quebec (by revenue) | 2,800 | March 31, 2023 | 3,030 | 3,400 | 2,840 |
| Value of Quebec goods’ exports | $86.0B | March 31, 2023 | $82.6B | $97.2B | $107.5B | |
| Value of Quebec clean tech exports | $2.6B | March 31, 2023 | $2.5B | $2.9B** | $2.7B | |
| Revenue growth rate of businesses supported by CED. programs | 2.0% | March 31, 2023 | NA* | 4.4% | NA* | |
| R2: Communities are economically diverse in Quebec | Percentage of Quebec SMEs that are majority-owned by women, Indigenous peoples, youth, visible minorities or persons with disabilities |
Women: 16.5% Indigenous: 0.8% Youth: 17.5% Visible minorities: 4.7% Persons with disabilities: 0.2% |
March 31, 2023 |
Women: NA* Indigenous: NA* Youth: NA* Visible minorities: NA* Persons with disabilities: NA* |
Women: 16.0% Indigenous: 1.1% Youth: 14.4% Visible minorities: 4.3% Persons with disabilities: 0.4% |
NA* |
| Percentage of professional positions in science and technology in Quebec’s economy | 38.0% | March 31, 2023 | 39.1% | 38.8% | 40.1% | |
| Amount leveraged per dollar invested in community projects | $2.20 | March 31, 2023 | $1.80 | $2.23 | $2.91 | |
| R3: Businesses invest in the development and commercialization of innovative technologies in Quebec | Value of R&D spending by businesses receiving CED program funding | $25M | March 31, 2023 | $32.8M | NA*** | NA*** |
| Percentage of businesses involved in collaborations with postsecondary institutions in Quebec | 22.0% | March 31, 2023 | 23.1% | NA* | NA* |
* The term "Not available" indicates that no data was published by Statistics Canada in that year (or since the last update to the table).
** The data in the table represent the latest results published by Statistics Canada. The figures presented for previous fiscal years are those available and may be updated in the current or a future fiscal year.
*** Data not available. CED is currently reviewing the methodology used to measure this indicator.
Financial, human resources and performance information for CED’s program inventory is available in GC InfoBaseFootnote 12.
Budgetary financial resources (dollars)
The following table shows, for Developing Quebec’s economy, budgetary spending for 2022–23, as well as actual spending for that year.
| 2022–23 Main Estimates |
2022–23 Planned spending |
2022–23 Total authorities available for use |
2022–23 Actual spending (authorities used) |
2022–23 Difference (actual spending minus planned spending) |
|---|---|---|---|---|
| 563,047,357 | 563,047,357 | 690,913,419 | 519,573,605 | (43,473,752) |
The difference of $43.5M (-7.7%) between planned spending and actual spending for 2022–23 is due in large part to two economic recovery initiatives, namely the Major Festivals and Events Support Initiative (MFESI) and the Aerospace Regional Recovery Initiative (ARRI). Various external factors had an impact on the pace at which proponents carried out projects, including inflation, shortages of workers and subcontractors, and supply chain disruptions. CED adjusted its spending to adapt to clients’ new project implementation schedules so they could achieve the expected results.
The financial, human resources and performance information for CED’s program inventory is available on GC InfoBaseFootnote 13.
Human resources (full-time equivalents)
The following table, shows, in full-time equivalents, the human resources that the department needed to fulfill this core responsibility in 2022–23.
| 2022–23 Planned full-time equivalents |
2022–23 Actual full-time equivalents |
2022–23 Difference (actual full-time equivalents minus planned full-time equivalents) |
|---|---|---|
| 206 | 212 | 6 |
Financial, human resources and performance information for CED’s Program Inventory is available on GC InfoBaseFootnote 14.
Internal services
Description
Internal Services are those groups of related activities and resources that the federal government considers to be services in support of programs and/or required to meet an organization’s corporate obligations. Internal services refer to the activities and resources of the 10 distinct service categories that support program delivery in the organization, regardless of the internal services delivery model in a department. The 10 service categories are:
- acquisition management services
- communication services
- financial management services
- human resources management services
- information management services
- information technology services
- legal services
- material management services
- management and oversight services
- real property management services
Results
The 2022–23 fiscal year was the second year of the Imagining 2024 initiative, an internal management framework aimed at achieving concrete organizational results based on three pillars: a committed team in a healthy, modern environment; a recognized contribution and tailored services. To fulfill its mission more effectively, CED has focused on modernizing its processes and tools, and on continuous improvement of the way it operates.
We made progress in our actions aligned with Imagining 2024. These achievements include the following:
Implementation of the hybrid work model
CED was ready for the implementation of common hybrid work model for the Federal Public Service announced by the Treasury Board Secretariat (TBS) in December 2022.
- Team charters were developed to facilitate the return to the workplace and collaboration within teams.
- Governance, internal directives and tools were distributed to managers and staff to support them in this new reality.
- The layouts of several spaces were reconfigured to optimize their use, and technologies were upgraded at all business offices to allow for hybrid service delivery.
Conducting organizational optimization exercises
Organizational optimization exercises in targeted sectors, including human resources and information technology, were carried out to adapt to our changing environment and the needs of internal clients.
With respect to human resources, we have optimized our application management tools to improve the employee experience, reviewed our compensation service delivery model, streamlined and modernized our employee award of excellence program and reviewed our intake activity for new employees to maximize its relevance and effectiveness.
In terms of information technology, we experimented with departmental videoconference systems and conducted employee surveys to improve their experience. We also launched the FlexiDesk application to give users a simple, user-friendly way to reserve office spaces.
Digital empowerment of employees and development of skills in using new tools
To facilitate the digital empowerment of staff to face the challenges of societal transformation, including those imposed by the emergence of remote work and new technologies, CED has:
- developed a digital skills framework;
- conducted a digital skills development pilot project at one of its business offices to identify the skills requiring improvement, provide mandatory development activities and assess the perception of the level of proficiency pre/post-digital skills; and
- held digital clinics to equip employees to use the new technological tools in place.
Contracts awarded to Indigenous businesses
CED supports the Government of Canada’s commitment to awarding 5% of the total value of contracts each year to Indigenous businesses. CED is part of Phase 2 of the Procurement Strategy for Indigenous Businesses (PSIB) and forecasted that, by the end of the 2023–24, it would award 5% of the total value of its contracts to Indigenous businesses. To that end, we have opted for a gradual implementation of our procurement strategies. We have therefore:
- organized internal awareness sessions on the importance and duty, where possible, to use Indigenous businesses for our goods and services procurement needs; and
- added a PSIB section to our strategic procurement plan, including the following actions to ensure that we achieve our objective:
- systematically identify early in the process the capacity of the Indigenous market to meet the need;
- use the directory of Indigenous businesses to identify qualified suppliers in various industries;
- use mandatory supply arrangements (SA), including PSIB clauses for the acquisition of goods;
- use set-aside contracting methods (mandatory, voluntary and conditional set‑aside); and
- identify and invite Indigenous businesses to take part in open tenders on invitation.
- Through the creation of a training curriculum specially prepared for technical authorities, we have ensured that all employees on the procurement and contracting team take the Indigenous Considerations in Procurement and Procurement in Nunavut Settlement courses.
Budgetary financial resources (dollars)
The following table shows, for internal services, budgetary spending for 2022–23, as well as spending for that year.
| 2022–23 Main Estimates |
2022–23 Planned spending |
2022–23 Total authorities available for use |
2022–23 Actual spending (authorities used) |
2022–23 Difference (actual spending minus planned spending) |
|---|---|---|---|---|
| 23,124,239 | 23,124,239 | 24,311,226 | 24,541,115 | 1,416,876 |
Human resources (full-time equivalents)
The following table shows, in full time equivalents, the human resources the department needed to carry out its internal services for 2022–23.
| 2022–23 Planned full-time equivalents |
2022–23 Actual full-time equivalents |
2022–23 Difference (actual full-time equivalents minus planned full-time equivalents) |
|---|---|---|
| 178 | 168 | (10) |
Spending and human resources
Spending
Spending 2020–21 to 2025–26
The following graph presents planned spending (voted and statutory) over time.
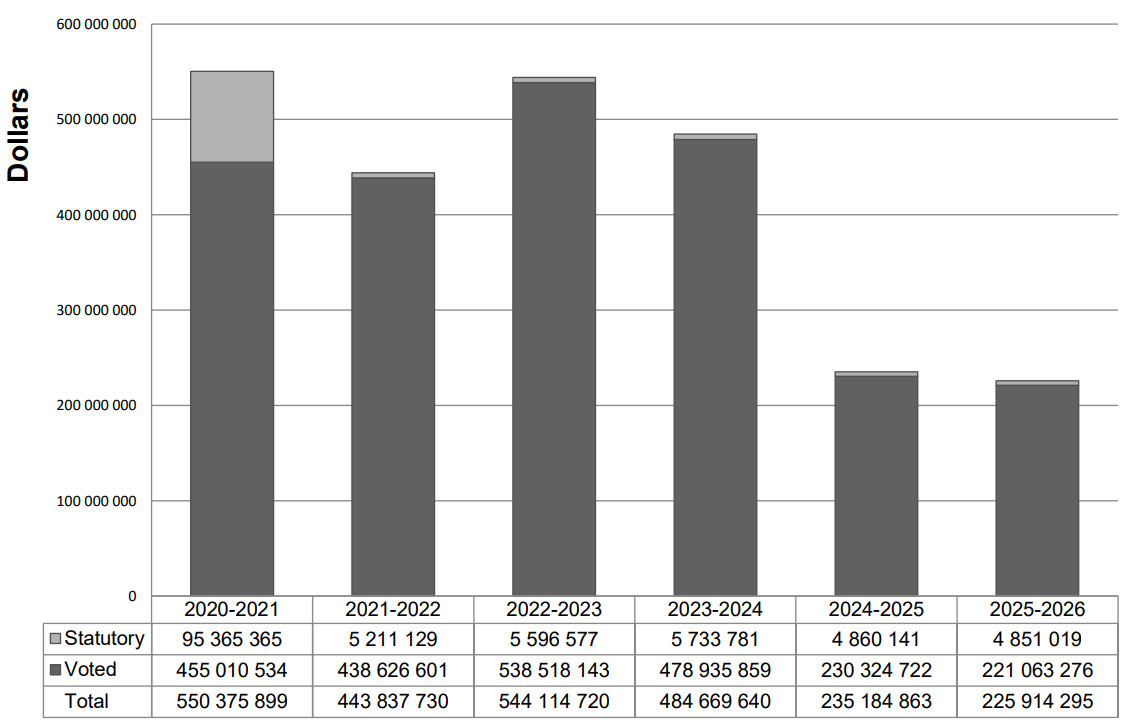
Text version:
From 2020-2021 to 2025-2026, planned statutory spending reached:
- 95 365 365 $ in 2020-2021
- 5 211 129 $ in 2021-2022
- 5 596 577 $ in 2022-2023
- 5 733 781 $ in 2023-2024
- 4 860 141 $ in 2024-2025
- 4 851 019 $ in 2025-2026
From 2020-2021 to 2025-2026, planned voted spending reached:
- 455 010 534 $ in 2020-2021
- 438 626 601 $ in 2021-2022
- 538 518 143 $ in 2022-2023
- 478 935 859 $ in 2023-2024
- 230 324 722 $ in 2024-2025
- 221 063 276 $ in 2025-2026
From 2020-2021 to 2025-2026, total planned spending reached:
- 550 375 899 $ in 2020-2021
- 443 837 730 $ in 2021-2022
- 544 114 720 $ in 2022-2023
- 484 669 640 $ in 2023-2024
- 235 184 863 $ in 2024-2025
- 225 914 295 $ in 2025-2026
Spending varies over time, based primarily on the temporary and targeted funding received by CED. In recent years, CED obtained funding to deal with the economic crisis caused by COVID‑19. That funding enabled CED to implement several ad hoc and targeted initiatives, including the RRRF, designed to support SMEs and NPOs during the pandemic. Those were administered on an ad hoc basis through temporary statutory appropriations in 2020–21 due to the urgency of the situation.
The end of those statutory funds explains the sharp decrease in spending in 2021–22. In addition, many projects were postponed in 2022–23 due to the economic slowdown caused by the labour shortage and by the prices and supply difficulties related to many materials.
Launched in late 2021–22, the economic recovery initiatives were put in place to mitigate these specific economic conditions, which explains the increase in planned spending in 2022–23. The G&C funds carried over from unused budgets in 2021–22 also contribute to the results for 2022-23. Although the moratorium on repayments granted to our clients in 2020–21 to help them address the cash shortfall caused by the pandemic caused a shortfall in G&C budgets in 2022–23, a $15M advance on reimbursements from 2023–24 was granted to reduce the effect of the moratorium and maintain an investment capacity for new projects.
The decrease in planned spending in 2023–24 is less significant than the planed decrease in 2024–25 because certain initiatives scheduled to end in 2022–23 were extended for a year to meet the needs of the proponents, who required more time to complete their projects. As a result, several requests to carry forward unused budgets in 2022–23 were approved.
The marked reduction in planned spending in 2024–25 is explained by the end of the economic recovery initiatives on March 31, 2024, but also by the fact that planned spending does not include our client’s refundable contributions, as the authorities had not been obtained when this report was prepared.
Budgetary performance summary for core responsibilities and internal services (dollars)
The “Budgetary performance summary for core responsibilities and internal services” table presents the budgetary financial resources allocated for CED’s core responsibilities and internal services.
| Core Responsibility and Internal Services | 2022–23 Main Estimates |
2022–23 Planned Spending |
2023–24 Planned Spending |
2024–25 Planned Spending |
2022–23 Total authorities available for use |
2020–21 Actual spending (authorities used) |
2021–22 Actual spending (authorities used) |
2022–23 Actual spending (authorities used) |
|---|---|---|---|---|---|---|---|---|
| Developing Quebec’s economy | 563,047,357 | 563,047,357 | 461,433,534 | 215,068,028 | 690,913,419 | 527,799,525 | 419,042,755 | 519,573,605 |
| Internal Services | 23,124,239 | 23,124,239 | 23,236,106 | 20,116,835 | 24,311,226 | 22,576,374 | 24,794,976 | 24,541,115 |
| Total | 586,171,596 | 586,171,596 | 484,669,640 | 235,184,863 | 715,224,645 | 550,375,899 | 443,837,731 | 544,114,720 |
The CED budget consists of recurring funding used in the delivery of regular programs, and temporary funding used to deliver ad hoc and targeted initiatives. The recurring budget remains stable over the years, while the temporary budgets vary based on economic conditions and events that have a major impact on businesses or communities, such as the rail accident in Lac‑Mégantic.
Planned spending in 2023–24 totals $484.7M. That reduction of $101.5M between 2022–23 and 2023–24 is due primarily to the reduction in funding available for economic recovery initiatives, including the Tourism Relief Fund (TRF) and the Community Revitalization Fund (CCRF), and the end of funding for the Regional Air Transportation Initiative (RATI).
In 2023–24, G&C planned funding for recovery initiatives is as follows:
- $57.9M for the Jobs and Growth Fund (JGF)
- $43.9M for the Aerospace Regional Recovery Initiative (ARRI)
- $30.5M for the Canadian Community Revitalization Fund (CCRF)
- $26.1M for the Major Festivals and Events Support Initiative (MFESI)
- $22.5M for the Tourism Relief Fund (TRF)
The reduction in planned spending in 2024–25 is explained by the be fact that these initiatives end on March 31, 2024.
Human resources
The “Human resources summary for core responsibilities and internal services” table presents the full-time equivalents (FTEs) allocated to each of CED’s core responsibilities and internal services.
Human resources summary for core responsibilities and internal services
| Core responsibility and internal services | 2020–21 Actual full-time equivalents |
2021–22 Actual full-time equivalents |
2022–23 Planned full-time equivalents |
2022–23 Actual full-time equivalents |
2023–24 Planned full-time equivalents |
2024–25 Planned full-time equivalents |
|---|---|---|---|---|---|---|
| Developing Quebec’s economy | 189 | 213 | 206 | 212 | 205 | 175 |
| Internal Services | 170 | 180 | 178 | 168 | 178 | 152 |
| Total | 359 | 393 | 384 | 380 | 383 | 327 |
Expenditures by vote
For information on CED’s organizational voted and statutory expenditures, consult the Public Accounts of CanadaFootnote 15.
Government of Canada spending and activities
Information on the alignment of CED’s spending with Government of Canada’s spending and activities is available in GC InfoBaseFootnote 16.
Financial statements and financial statements highlights
Financial statements
CED’s financial statements (unaudited) for the fiscal year ended March 31, 2023, are available on the department’s websiteFootnote 17.
Financial statement highlights
The following highlights provide an overview of CED’s financial position and operations. The unaudited financial statements are prepared in accordance with the government’s accounting policies, which are based on Canadian generally accepted accounting principles for the public sector.
The expenditures presented in the tables in the other sections of the report are prepared using cash accounting, while the financial highlights below are prepared using accrual accounting. Tables reconciling these two accounting methods are available in the notes to CED’s financial statements.
A more detailed statement of operations and related notes, including a reconciliation of net operating costs and requested authorities, is available on the Department’s websiteFootnote 18.
| Financial information | 2022–23 Planned results |
2022–23 Actual results |
2021–22 Actual results |
Difference (2022–23 actual results minus 2022–23 planned results) |
Difference (2022–23 actual results minus 2021–22 actual results) |
|---|---|---|---|---|---|
| Total expenses | 374,284,000 | 402,994,064 | 283,543,785 | 28,710,064 | 119,450,279 |
| Total revenues | 0 | 0 | 0 | 0 | 0 |
| Net cost of operations before government funding and transfers | 374,284,000 | 402,994,064 | 283,543,785 | 28,710,064 | 119,450,279 |
Expenses
- In 2022–23, CED’s total expenses were $403.0 million, an increase of $119.5 million over the previous year. That 42.1% increase is due primarily to the increase in transfer payments. This significant variation in 2022–23 is explained by new funding for economic recovery initiatives. The economic recovery initiatives were put in place to help small and medium enterprises recover from the effects of the COVID-19 pandemic.
- Transfer payment expenses – totalling $343.1 million – increased by 52.7% between 2021-22 and 2022–23. Operating expenses total $59.9 million, an increase of 1.7% from last year.
- The difference of $28.7 million in planned net expenses is due primarily to the amount of transfer payments exceeding the forecast.
Revenues
- CED’s revenue, returned to the Treasury, is declared in its financial statements as having been earned on behalf of the government. Total net revenues for the organization are therefore nil. Revenues consist primarily of interest charged on defaulted payments.
The planned results information for 2022–23 is provided in the Future-oriented statement of operationsFootnote 19 and CED’s 2022–23 notes.
| Financial information | 2022–23 | 2021–22 | Difference (2022–23 minus 2021–22) |
|---|---|---|---|
| Total net liabilities | 37,335,846 | 25,412,298 | 11,923,548 |
| Total net financial assets | 32,905,270 | 20,972,577 | 11,932,693 |
| Departmental net debt | 4,430,576 | 4,439,721 | (9,145) |
| Total non-financial assets | 2,556,832 | 3,359,146 | (802,314) |
| Departmental net financial position | (1,873,744) | (1,080,575) | (793,169) |
Liabilities
- As of March 31, 2023, CED’s net liabilities totalled $37.3 million, up 46.9% compared to 2021–22. This increase is due primarily to the increase in accounts payable and accrued liabilities, representing 88.1% ($32.9 million) of total net liabilities.
- Vacation pay, compensatory leave and future benefits account respectively for 9.1% ($3.5 million) and 2.8% ($1.1 million) of the organization’s net liabilities.
Assets
- As of March 31, 2023, net financial assets totalled $32.9 million, up 56.9% from the previous year’s total assets. This increase is due primarily to an increase in amounts receivable from the treasury to pay liabilities (benefits and accounts receivable), which were also up.
- In addition, as of March 31, 2023, CED’s non-financial assets totalled $2.6 million, down 23.9% from the previous year. This decrease is due primarily to a decrease in prepaid expenses and tangible capital assets.
The planned results information for 2022–23 is provided in the Future-oriented statement of operationsFootnote 20 and CED’s 2022–23 notes.
Corporate information
Organizational profile
Appropriate minister: The Honourable Soraya Martinez Ferrada
Institutional head: Sony Perron
Ministerial portfolio: N/A
Enabling instrument(s): Economic Development Agency of Canada for the Regions of Quebec Act
Year of incorporation/commencement: 2005
Raison d’être, mandate and role: who we are and what we do
“Raison d’être, mandate and role: who we are and what we do” is available on the CED websiteFootnote 21.
Operating context
Information on the operating context is available on the CED websiteFootnote 22.
Reporting framework
CED’s departmental results framework and program inventory of record for 2022–23 are shown below.
| Core responsibility: Developing Quebec’s economy | |||
|---|---|---|---|
| Departmental results Framework | Departmental Result: Businesses are innovative and growing in Quebec | Indicator: Number of high-growth businesses in Quebec | Internal Services |
| Indicator: Value of Quebec goods’ exports (dollars) | |||
| Indicator: Value of Quebec clean tech exports (dollars) | |||
| Indicator: Revenue growth rate of businesses supported by CED programs | |||
| Departmental Result: Communities are economically diverse in Quebec | Indicator: Percentage of Quebec small and medium enterprises that are majority-owned by women, Indigenous peoples, youth, visible minorities or persons with disabilities | ||
| Indicator: Percentage of professional positions in science and technology in Quebec’s economy | |||
| Indicator: Percentage of businesses involved in collaborations with postsecondary institutions in Quebec | |||
| Departmental Result: Businesses invest in the development and commercialization of innovative technology in Quebec | Indicator: Percentage of businesses involved in collaborations with postsecondary institutions in Quebec | ||
| Indicator: Percentage of businesses involved in collaborations with postsecondary institutions in Quebec | |||
| Program Inventory | Program: Regional Innovation | ||
| Program: Community vitality | |||
| Program: Targeted or temporary support | |||
Supporting information on the program inventory
The financial, human resources and performance information for CED’s program inventory is available on GC InfoBaseFootnote 23.
Supplementary information tables
The following supplementary information tables are available on the CED websiteFootnote 24.
- Reporting on Green Procurement
- Details on transfer payment programs
- Gender-based analysis plus
- United Nations 2030 Agenda and Sustainable Development Goals
- Responses to parliamentary committees
Federal tax expenditures
The tax system can be used to achieve public policy objectives through the application of special measures, such as low tax rates, exemptions, deductions, deferrals and credits. The Department of Finance Canada publishes cost estimates and projections for these measures each year in the Report on Federal Tax ExpendituresFootnote 25. That report also provides detailed background information on tax expenditures, including descriptions, objectives, historical information and references to related federal spending programs, as well as GBA Plus evaluations and results related to tax expenditures.
Organizational contact information
Mailing address: 800 René-Lévesque Boulevard West, Suite 500, Montréal, Quebec, H3B 1X9
Telephone: 514-283-6412
Fax: 514-283-3302
Website: www.ced.canada.ca
Appendix: definitions
appropriation (crédit)
Any authority of Parliament to pay money out of the Consolidated Revenue Fund.
budgetary expenditures (dépenses budgétaires)
Operating and capital expenditures; transfer payments to other levels of government, organizations or individuals; and payments to Crown corporations.
core responsibility (responsabilité essentielle)
An enduring function or role performed by a department. The intentions of the department with respect to a core responsibility are reflected in one or more related departmental results that the department seeks to contribute to or influence.
Departmental Plan (plan ministériel)
A report on the plans and expected performance of an appropriated department over a 3‑year period. Departmental Plans are usually tabled in Parliament each spring.
departmental priority (priorité)
A plan or project that a department has chosen to focus and report on during the planning period. Priorities represent the things that are most important or what must be done first to support the achievement of the desired departmental results.
departmental result (résultat ministériel)
A consequence or outcome that a department seeks to achieve. A departmental result is often outside departments’ immediate control, but it should be influenced by program-level outcomes.
departmental result indicator (indicateur de résultat ministériel)
A quantitative measure of progress on a departmental result.
departmental results framework (cadre ministériel des résultats)
A framework that connects the department’s core responsibilities to its departmental results and departmental result indicators.
Departmental Results Report (rapport sur les résultats ministériels)
A report on a department’s actual accomplishments against the plans, priorities and expected results set out in the corresponding Departmental Plan.
full‑time equivalent (équivalent temps plein)
A measure of the extent to which an employee represents a full person‑year charge against a departmental budget. For a particular position, the full‑time equivalent figure is the ratio of number of hours the person actually works divided by the standard number of hours set out in the person’s collective agreement.
gender-based analysis plus (GBA Plus) (analyse comparative entre les sexes plus [ACS Plus])
An analytical tool used to support the development of responsive and inclusive policies, programs and other initiatives; and understand how factors such as sex, race, national and ethnic origin, Indigenous origin or identity, age, sexual orientation, socio-economic conditions, geography, culture and disability, impact experiences and outcomes, and can affect access to and experience of government programs.
government-wide priorities (priorités pangouvernementales)
For the purpose of the 2022–23 Departmental Results Report, government-wide priorities are the high-level themes outlining the government’s agenda in the November 23, 2021, Speech from the Throne: building a healthier today and tomorrow; growing a more resilient economy; bolder climate action; fighter harder for safer communities; standing up for diversity and inclusion; moving faster on the path to reconciliation; and fighting for a secure, just and equitable world.
horizontal initiative (initiative horizontale)
An initiative where two or more federal organizations are given funding to pursue a shared outcome, often linked to a government priority.
non‑budgetary expenditures (dépenses non budgétaires)
Net outlays and receipts related to loans, investments and advances, which change the composition of the financial assets of the Government of Canada.
performance (rendement)
What an organization did with its resources to achieve its results, how well those results compare to what the organization intended to achieve, and how well lessons learned have been identified.
performance indicator (indicateur de rendement)
A qualitative or quantitative means of measuring an output or outcome, with the intention of gauging the performance of an organization, program, policy or initiative respecting expected results.
performance reporting (production de rapports sur le rendement)
The process of communicating evidence‑based performance information. Performance reporting supports decision making, accountability and transparency.
plan (plan)
The articulation of strategic choices, which provides information on how an organization intends to achieve its priorities and associated results. Generally, a plan will explain the logic behind the strategies chosen and tend to focus on actions that lead to the expected result.
planned spending (dépenses prévues)
For Departmental Plans and Departmental Results Reports, planned spending refers to those amounts presented in Main Estimates.
A department is expected to be aware of the authorities that it has sought and received. The determination of planned spending is a departmental responsibility, and departments must be able to defend the expenditure and accrual numbers presented in their Departmental Plans and Departmental Results Reports.
program (programme)
Individual or groups of services, activities or combinations thereof that are managed together within the department and focus on a specific set of outputs, outcomes or service levels.
program inventory (répertoire des programmes)
Identifies all the department’s programs and describes how resources are organized to contribute to the department’s core responsibilities and results.
result (résultat)
A consequence attributed, in part, to an organization, policy, program or initiative. Results are not within the control of a single organization, policy, program or initiative; instead they are within the area of the organization’s influence.
Indigenous business (enterprise autochtones)
For the purpose of the Directive on the Management of Procurement Appendix E: Mandatory Procedures for Contracts Awarded to Indigenous Businesses and the Government of Canada’s commitment that a mandatory minimum target of 5% of the total value of contracts is awarded to Indigenous businesses, an organization that meets the definition and requirements as defined by the Indigenous Business Directory.
statutory expenditures (dépenses législatives)
Expenditures that Parliament has approved through legislation other than appropriation acts. The legislation sets out the purpose of the expenditures and the terms and conditions under which they may be made.
target (cible)
A measurable performance or success level that an organization, program or initiative plans to achieve within a specified time period. Targets can be either quantitative or qualitative.
voted expenditures (dépenses votées)
Expenditures that Parliament approves annually through an appropriation act. The vote wording becomes the governing conditions under which these expenditures may be made.