
Debrief on the impact of international border closures on tourism in Canada
Economic Intelligence Directorate
The closing of international borders due to COVID-19: who are the winners and losers? How has Canada fared? Let’s take a closer look.
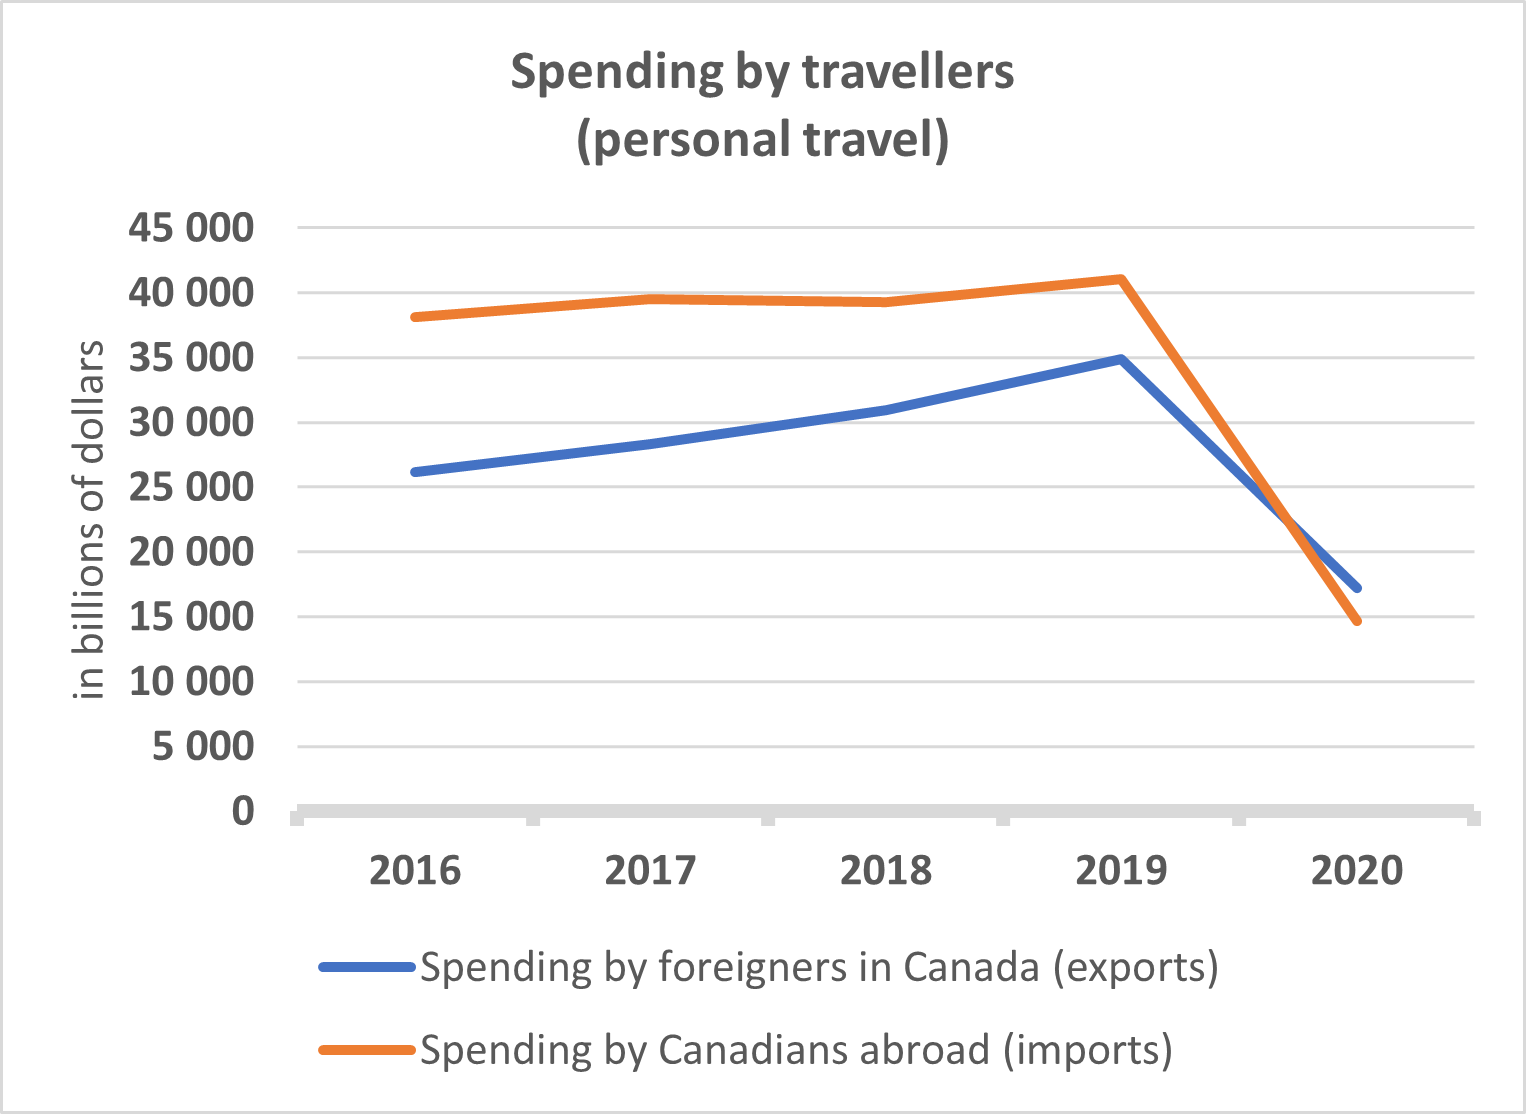
Historically, Canadians spend more abroad than foreigners spend in Canada. Pre-COVID, for every dollar that foreigners spent in Canada, Canadians spent two abroad.
So, did the closure of international borders limit or even reverse this trend? Did it result in a net gain for the Canadian economy?
Based on the figures, the answer to both questions is yes.
Text version
| in $billions | 2016 | 2017 | 2018 | 2019 | 2020 | ||
|---|---|---|---|---|---|---|---|
| Spending by foreigners in Canada (exports) | 26,126 | 28,322 | 30,971 | 34,838 | 17,229 | ||
| Spending by Canadians abroad (imports) | 38,098 | 39,522 | 39,308 | 41,073 | 14,654 | ||
|
Graphic illustrating the 64% drop in spending by Canadians abroad from 2019 to 2020. Source: Statistics Canada, Table 36-10-0004-01 |
|||||||
The balance (exports vs. imports) for personal travel spending Note de bas de page 1 increased by $8.8 billion in 2020 compared to 2019 and went from a deficit to a surplus. In short, during the pandemic, less money came in, but even less went out!
Here’s what happened. Between 2019 and 2020, exports (spending by foreigners in Canada) fell by 51%, from $34.8 billion to $17.2 billion, while imports (spending by Canadians abroad) fell by 64%, from $41.1 billion to $14.7 billion.
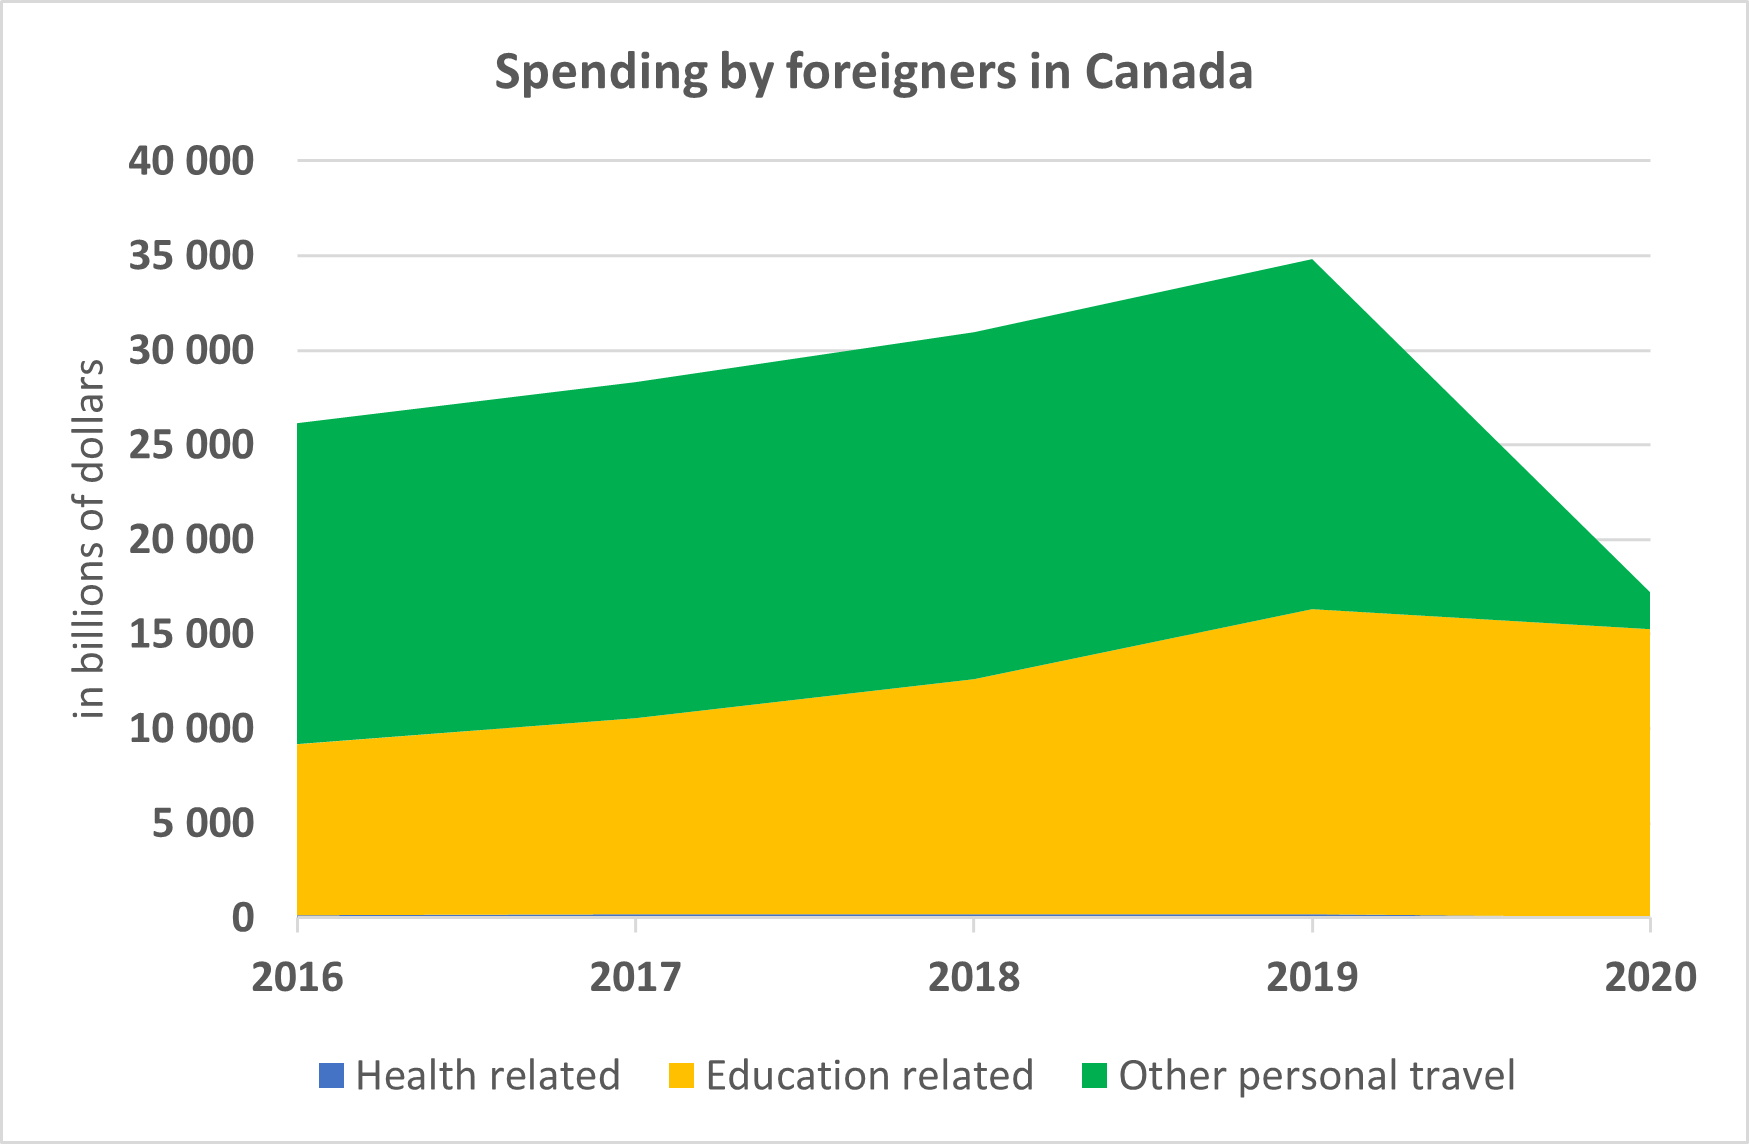
Although impressive, these statistics do not fully capture the effect of border closures on international tourism, as they include expenditures related to education and health care.
Text version
| in $billion | 2016 | 2017 | 2018 | 2019 | 2020 | ||
|---|---|---|---|---|---|---|---|
| Health care | 163 | 169 | 176 | 182 | 30 | ||
| Education | 9,027 | 10,371 | 12,457 | 16,108 | 15,230 | ||
| Other travel for personal reasons | 16,936 | 782 | 18,338 | 18,548 | 1,969 | ||
|
Graphic illustrating the 89% drop in the "Other travel for personal reasons" category for spending by foreign travellers to Canada between 2019 and 2020. Source: Statistics Canada, Table 36-10-0004-01 |
|||||||
Text version
| in $billion | 2016 | 2017 | 2018 | 2019 | 2020 | ||
|---|---|---|---|---|---|---|---|
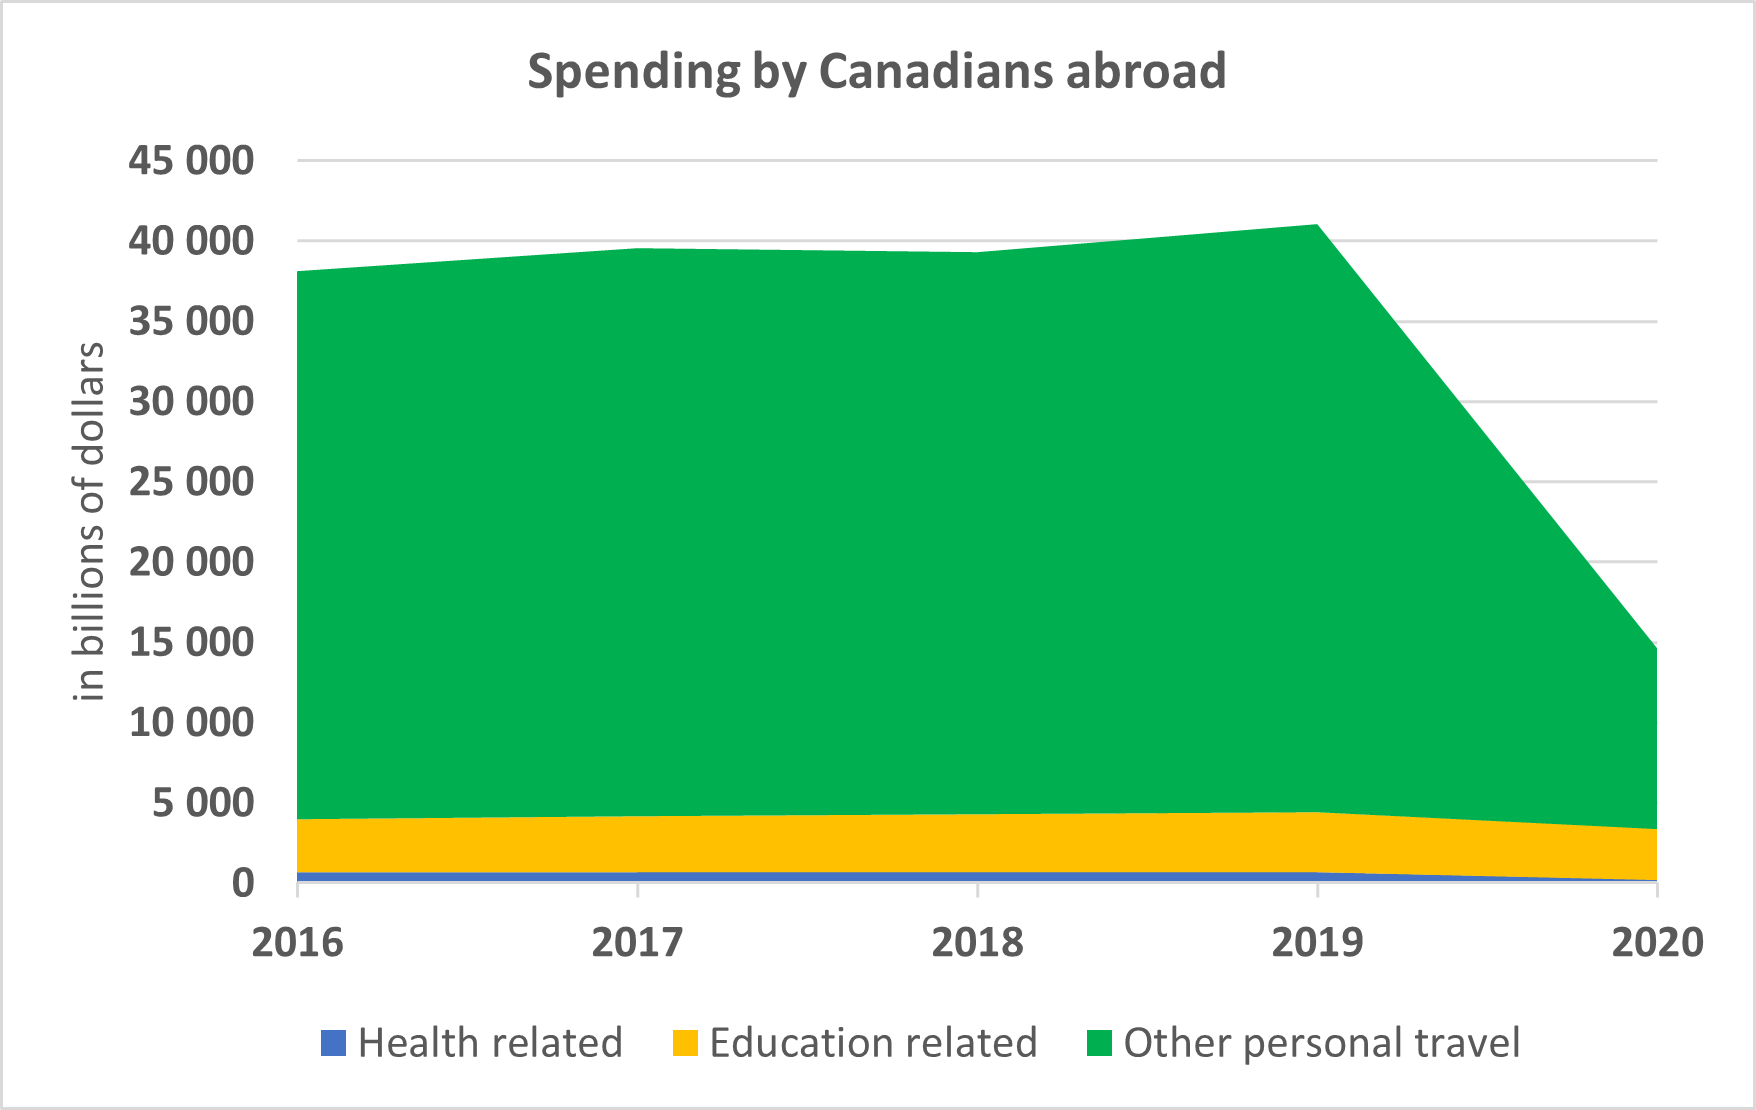
| Health care | 680 | 690 | 690 | 690 | 211 | ||
| Education | 3,324 | 3,453 | 3,591 | 3,734 | 3,178 | ||
| Other travel for personal reasons | 34,094 | 35,379 | 35,027 | 36,649 | 11,265 | ||
|
Graphic illustrating the 69% drop in the "Other travel for personal reasons" category for spending by Canadians abroad between 2019 and 2020. Source: Statistics Canada, Table 36-10-0004-01 |
|||||||
If we look at personal travel (excluding personal travel related to health care or education), spending by foreigners in Canada fell by 89% (from $18.5 billion to $2.0 billion), while spending by Canadians abroad fell by 69% (from $36.6 billion to $11.3 billion).
Obviously, the decline in imports was smaller than the decline in exports, which is to be expected since foreigners could not enter Canada, whereas Canadians could. The deficit fell from $18.1 billion to $9.3 billion—so there was still a deficit, but it was half the size.
If Canada had an overall surplus in 2020, it is thanks to students ($12.1 billion surplus): more foreign students come to study in Canada than the opposite. And the numbers remained relatively stable between 2019 and 2020, as did the surplus.
To summarize, for all types of personal travel combined, we have gone from a $6.2 billion deficit to a $2.6 billion surplus. That’s an additional $8.8 billion in the Canadian economy in 2020.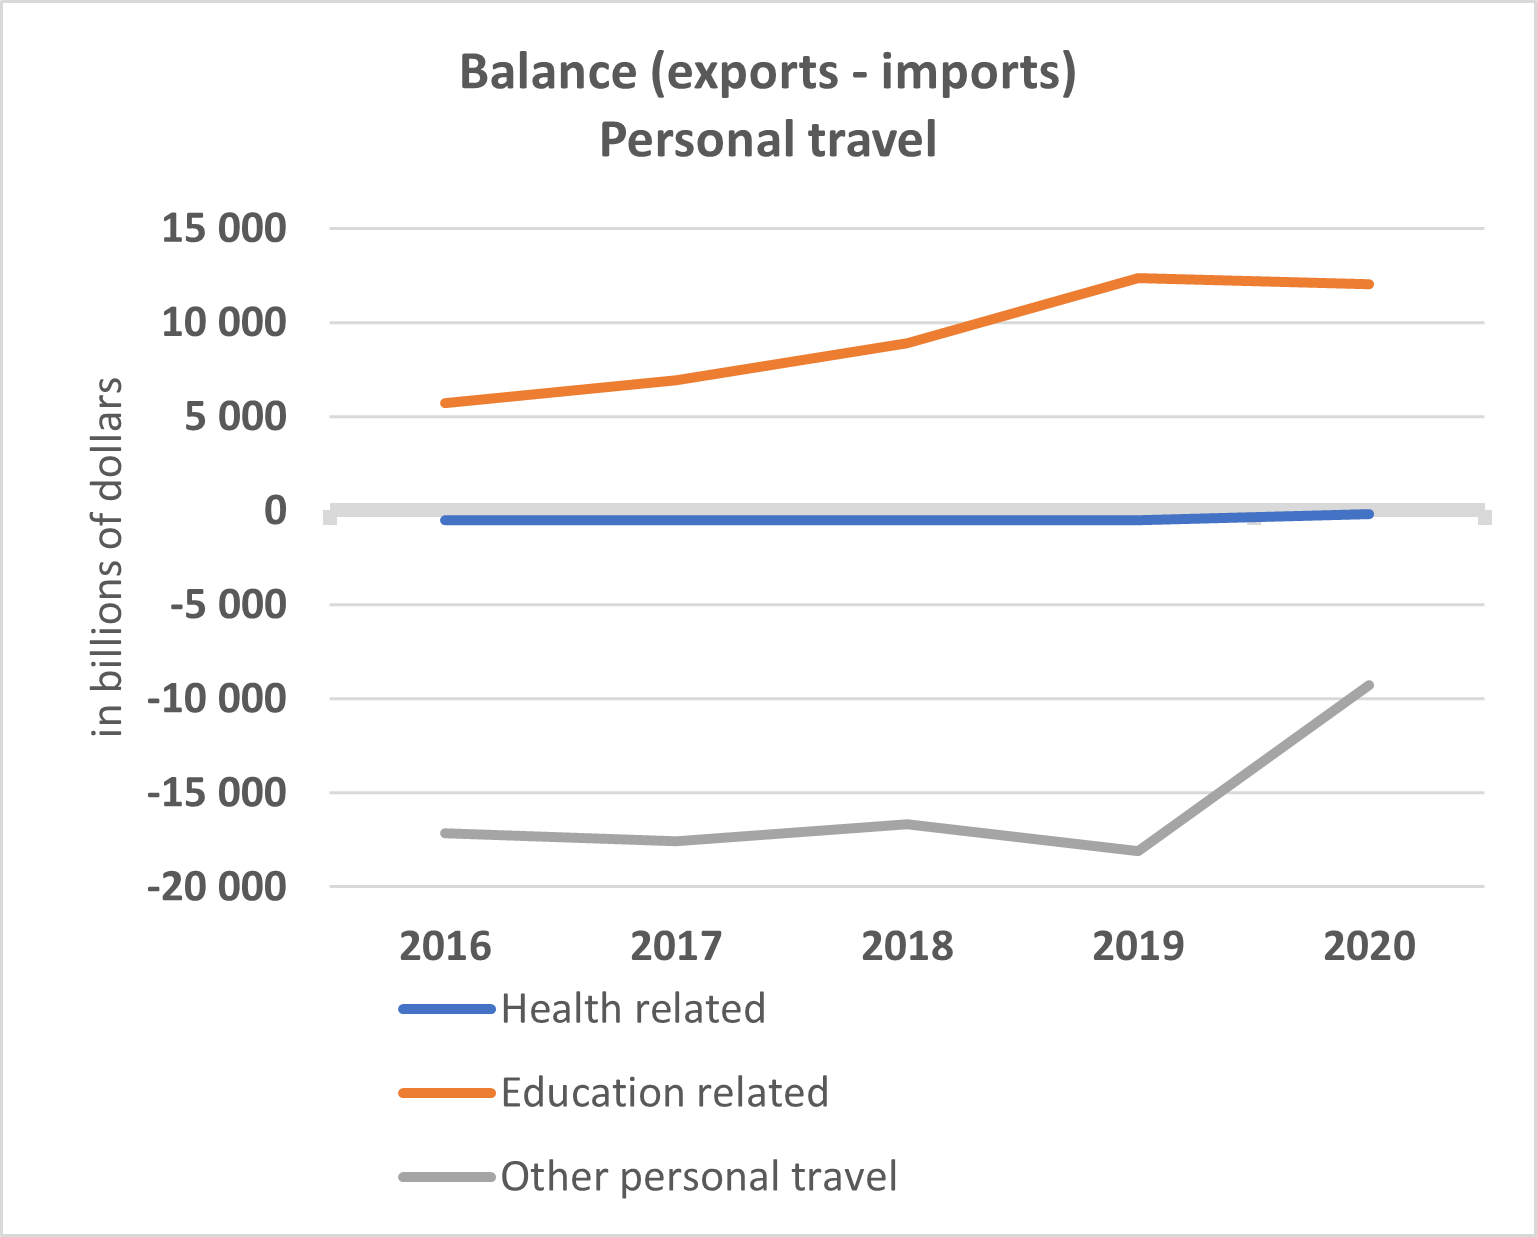
Text version
| in $billion | 2016 | 2017 | 2018 | 2019 | 2020 | ||
|---|---|---|---|---|---|---|---|
| Health care | -517 | -521 | -514 | -508 | -181 | ||
| Education | 5,703 | 6,918 | 8,867 | 12,374 | 12,052 | ||
| Other travel for personal reasons | -17,158 | -17,597 | -16,689 | -18,101 | -9,296 | ||
|
Graphic illustrating the drop by half in the deficit for the "Other travel for personal reasons" category and a stable surplus for the "Education" component from 2019 to 2020. Source: Statistics Canada, Table 36-10-0004-01 |
|||||||
However, this windfall does not benefit just the Canadian tourism industry. It is unlikely that the entire $8.8 billion was spent on “local” tourism. Some of it probably went elsewhere, i.e., to other industries (people bought a swimming pool with the money set aside for their trip down south) or elsewhere geographically (local tourists went where they wanted to go, rather than where international tourists were lacking). On this point, it seems that Quebec tourists do not necessarily have the same preferences as foreign tourists (interest for the same places, for the same attractions, etc.). Montréal is a good example—it is popular among foreign tourists but shunned by Quebecers.
In short, it’s not money that’s lacking. There’s even more than before, but it’s not necessarily being spent in the same industries or in the same regions as it used to be—which is why we are observing significant regional disparities in the tourism sector recovery.