This web page has been archived.
The information is no longer current but is retained on the website for reference or to provide context to current content.
Transition Binder for the Minister of Economic Development and Official Languages - 2019
Download the printer-friendly version (PDF)
About this publication
Publication author : Canada Economic Development for Quebec Regions
Publish date : March 18, 2020
Table of Contents
1. Strategic Considerations
On this page
- The economy of Quebec and its regions
- CED’s mandate and strategic foundations
- CED: Federal partner for regional economic development in Quebec
- History and context of regional development agencies
The economy of Quebec and its regions
Economic portrait of Quebec
Quebec has 8.45 million inhabitants, representing 22.6% of the population of Canada. Despite vigorous growth in recent years, Quebec’s economic weight remains less important than its demographic weight within Canada: its Gross Domestic Product (GDP) ($366 billion in 2018) accounts for 18.9% of Canada's GDP. In addition, Quebec represents only 16.4% of international exports and 16.4% of investments in Canada.
Overview
Quebec's economy is diversified. Its industrial fabric is based on services, manufacturing activities, construction and natural resources.
Advanced, emerging and green technologies, as well as start-ups, occupy a growing place in Quebec’s economy. The services sector is by far the largest, both in terms of employment (81%) and production (76%). It is also the sector with the fastest growth in recent decades.
Manufacturing also plays an important role and generates significant economic spin-offs, representing 14% of Quebec's GDP and more than 80% of the value of exports. About 13,570 manufacturing firms are present in Quebec, mainly small businesses: 52% of Quebec small and medium-sized enterprises (SMEs) have fewer than 10 employees.
Primary activities (agriculture, mining, forestry and fishing) represent a small share of employment (2%) and GDP (4%), although they play a crucial role in many rural communities.
More generally, the importance of SMEs in Quebec cannot be underestimated: 241,000 SMEs account for 87% of jobs in the private sector and continue to generate the vast majority of new jobs.
Quebec's economy is also open to the world, with 10,827 exporting companies. In 2018, the value of Quebec exports reached $92.3 billion, an increase of 8.2% over 2017. Major exports include aerospace products, aluminum, paper, and iron ores and concentrates.
Economic issues
Global changes observed around the world, such as an aging population, the growing wealth of emerging countries, increasing consumerism, the 4th industrial revolution, the intensifying innovation and investment race, climate change and the rise of protectionism are exacerbating certain issues for the Quebec economy:
- Lower productivity.Quebec is chronically behind in terms of productivity, jeopardizing the competitiveness of its businesses and its prosperity. In terms of productivity per hour worked, Quebec ranks 7th in Canada, which is itself lagging behind other G7 countries (6th). Innovation and, in particular, the adoption of new technologies are key to making productivity gains and ensuring business growth. However, Quebec companies are slow to make the necessary investments.
- Gaps in marketing. Quebec faces marketing shortcomings. In terms of innovation, fewer Quebec companies convert their R&D efforts into patents. In terms of international trade, Quebec exporters remain heavily dependent on the U.S. market. The low scale-up of Quebec companies and the lack of medium-sized and large companies are adversely affecting Quebec's marketing (and productivity) performance. International trade is occurring more than ever through the supply chains of large companies. The integration of SMEs into these chains is crucial.
- Difficulties in community adaptation. Many often rural communities in Quebec lack the infrastructure to face technological, economic and climate changes to ensure their prosperity. Many of them are dependent on declining or at-risk industrial activities. Outside major urban centers (Montreal, Quebec, Gatineau and Sherbrooke), the demographic and economic outlook is worrisome. There is both a decrease in the population and an exodus of young people.
- Scarcity of labour.Quebec is approaching full employment, with unemployment at a historic low (5.5% in 2018). Labour shortages will continue to put pressure on SMEs: many must postpone projects or refuse contracts because of a lack of workers. The economy is also expected to continue to feel the effects of an aging population, which is slowing down GDP growth. Indeed, an aging population is less likely to participate in the labour market and contributes less to consumer spending (main contribution to GDP).
- Declining entrepreneurial intensity and weak business growth. Historically, Quebec has always lagged behind in terms of entrepreneurship. Today, in a global context that is creating new business opportunities, Quebec is facing a shortfall in filling the massive departure of aging entrepreneurs, whose succession often remains inadequately or poorly prepared. According to the Centre de transfert d’entreprises du Québec, by 2020 “an estimated 60,000 potential successors are expected for the 98,000 entrepreneurs who are retiring.” Furthermore, the low scale-up of Quebec companies and the lack of medium-sized and large companies are adversely affecting Quebec's performance in terms of innovation, productivity and marketing.
2019-2020 economic outlook
After vigorous growth in the last two years, with real GDP growth of 2.9% in 2017 and 2.5% in 2018, Quebec’s economy is expected to grow in 2019 and 2020 but at a more moderate pace. Real GDP growth could reach 1.9% in 2019 and 1.4% in 2020.
In 2019, the strength of household consumption and the resumption of private investment will be strong areas of support. On the consumption side, spending will continue to rise even if household debt is at historically very high levels. In the case of investments, they are expected to reach $41.4 billion in 2019—an anticipated gain of 5.7% over 2018. In particular, private expenditures (in construction and on machinery and equipment) will stand out (+10.6%) after a few years of decline. Public spending, meanwhile, is expected to increase by 1.3%.
The Quebec economy in figures
| Indicator | Value | Comment |
|---|---|---|
| Population (as of April 1, 2019) | 8.45 million | 22.6% of the population of Canada |
| Proportion of the population aged 65 and over (2018) |
18.8% | Projected to be 25% in 2031 |
| Gross domestic product [GDP] (2018) | $365.6 billion | 18.9% of Canada’s GDP |
| Quebec exports to other countries as a % of GDP (2017) | 27.1% | Significantly higher than the proportion of exports to other provinces (18.7% in 2017) |
| Jobs (2018) | 4.26 million | 22.8% of jobs in Canada |
| Unemployment rate (2018) | 5.5% | Slightly below the national average of 5.8% |
| Employment rate for women aged 25 to 54 (2018) |
82.8% | Highest in the country |
| Job vacancy rate (first quarter 2019) |
3.1% | Same as in Canada overall |
| Average after-tax family income (2017) | $63,200 | $73,200 in Canada |
| Business productivity per hour worked (2018) | $48.30 | $56.00 in Canada |
| Percentage of employees who work in SMEs (2018) [businesses with 1 to 499 employees] |
57.1% | 54.7% in Canada |
| Private investment (Perspectives 2019) |
$20.5 billion | 12.7% of the total for Canada |
Sources: Statistics Canada, tables 17-10-0009-01, 17-10-0005-01, 36-10-0222-01, 14-10-0327-01, 14-10-0325-01, 11-10-0190-01, 36-10-0480-01, 14-10-0215-01 and 34-10-0038-01 / Institut de la statistique du Québec, Perspectives démographiques du Québec et des régions
Sector overview
Present in all sectors, Quebec’s economy overall is diversified. Quebec ranks first among the provinces in terms of an economically diverse industrial structure (according to the Hachman IndexFootnote1). The situation varies, however, among the sub-regions of Quebec.
| Diversification in terms of employment | Ranks 1st in Canada |
|---|---|
| Diversification in terms of GDP | Ranks 2nd in Canada |
Sources: Statistics Canada and internal calculations
The industrial fabric of Quebec’s economy is based, in order of importance, on services, manufacturing, construction and natural resources (primary).
| GDP | Employment | |||
|---|---|---|---|---|
| Quebec | Canada | Quebec | Canada | |
| Primary | 4% | 10% | 2% | 3% |
| Primary | 6% | 7% | 6% | 8% |
| Manufacturing | 14% | 10% | 11% | 8% |
| Services | 76% | 73% | 81% | 80% |
Manufacturing plays a key role in Quebec’s economy and generates significant economic spinoffs. All manufacturing activities are present in Quebec.
| GDP | Employment | |||
|---|---|---|---|---|
| Quebec | Canada | Quebec | Canada | |
| Manufacturing | 100% | 100% | 100% | 100% |
| Transportation equipment | 15% | 13% | 12% | 13% |
| Food products | 14% | 14% | 14% | 14% |
| Primary metal manufacturing | 9% | 6% | 5% | 4% |
| Metal products | 8% | 8% | 10% | 10% |
| Machinery | 7% | 9% | 8% | 9% |
| Chemical products | 7% | 10% | 5% | 6% |
| Paper | 6% | 4% | 5% | 4% |
| Plastic and rubber products | 5% | 5% | 6% | 7% |
| Wood products | 4% | 4% | 7% | 6% |
| Other | 26% | 26% | 30% | 28% |
Quebec’s economy by administrative region
Abitibi-Témiscamingue
| Key Economic Indicators | Abitibi-Témiscamingue | Quebec as a whole | |
|---|---|---|---|
| Demographics | Population. 2018 | 147 508 | 8 390 499 |
| Share of the total population of Quebec | 1.8% | 100% | |
| Growth from 2013 to 2018 | -0.2% | 3.4% | |
| Proportion of women | 49.0% | 50.1% | |
| By age group. 2018 | |||
| 0-24 | 27.4% | 26.8% | |
| 25-64 | 54.0% | 54.3% | |
| 65 and over | 18.6% | 18.8% | |
| Aboriginal identity population, 2016 | 8 165 | 182 885 | |
| First Nation | 5 580 | 92 655 | |
| Métis | 2 315 | 69 360 | |
| Inuit | 30 | 13 945 | |
| Labour market | Jobs, 2018 (thousands) | 77 | 4 262 |
| Share of the Quebec total | 1.8% | 100% | |
| Growth from 2013 to 2018 | 2.4% | 5% | |
| Unemployment rate, 2018 | 3.8% | 5.5% | |
| Participation rate, 2018 | 66.1% | 64.6% | |
| Employment rate, 2018 | 63.6% | 61% | |
| Vacant positions, 2019/Q1 | 2 635 | 114 215 | |
| Share of the Quebec total | 2.3% | 100% | |
| Growth from 2018/Q1 to 2019/Q1 | 13.3% | 23% | |
| Production | GDP, 2017 (billions $) | 8 | 385 |
| Share of the Quebec total | 2.0% | 100% | |
| Growth from 2012 to 2017 | 8.4% | 17.5% | |
| GDP per capita, 2017 | $52 958 | $46 392 | |
| Disposable income per capita, 2017 | $29 514 | $28 785 | |
| Industrial structure | Sector breakdown by jobs, 2018 | ||
| Goods-producing sector | 31.4% | 20.2% | |
| - Manufacturing | 7.8% | 11.5% | |
| Service sector | 68.8% | 79.8% | |
| Number of SMEs, December 2018 | 4 886 | 260 367 | |
| Share of the Quebec total | 1.9% | 100% | |
| Number of SMEs in manufacturing, December 2018 | 208 | 13 493 | |
| Share of the Quebec total | 2% | 100% | |
| Private investment, 2019 (millions $) | 1 429 | 20 554 | |
| Share of the Quebec total | 7% | 100% | |
| Growth from 2018 to 2019 | 13.5% | 10.6% | |
| Business export rate | 17.6% | 29.4% | |
| Advanced technology utilization rate, 2014 | 58% | 62.4% | |
| 2014 ranking among the 17 ARs | 16 | N/A | |
| Business climate | Number of devitalized RCMs according to the 2016 EDI | 3 out of 5 | 71 out of 104 |
| Entrepreneurship rate | 2.1% | 2.4% | |
| Number of universities | 1 | 17 | |
| Number of CEGEPs | 1 | 77 | |
| Number of CCTTs | 1 | 59 | |
| Name and rank (out of 125) of entrepreneurial cities as per CFIB, 2018 | Val-d'Or (9) and Rouyn-Noranda (24) | N/A | |
Consists of 5 RCMs: Témiscamingue, Rouyn-Noranda, Abitibi-Ouest, Abitibi and La Vallée-de-l'Or
Sources: Institut de la statistique du Québec, Statistics Canada, Centre de recherche industrielle du Québec (and CED's calculations), Ministère de l'Éducation et de l'Enseignement supérieur, Ministère de l'Économie et de l'Innovation, Wikipedia and the Canadian Federation of Independent Business
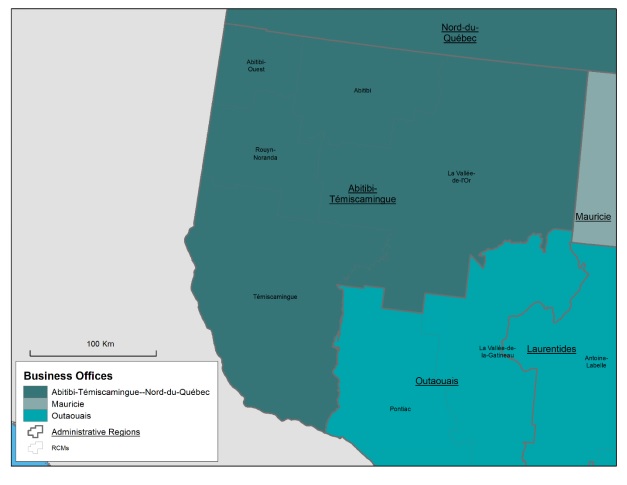
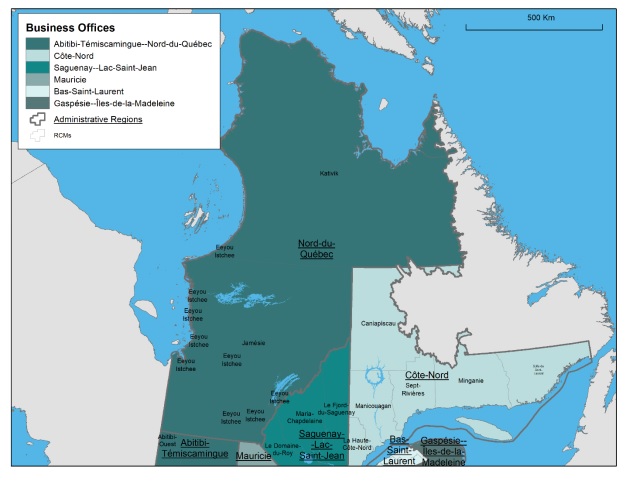
Map Description
Map of the Abitibi-Témiscamingue administrative region, the regional county municipalities (RCMs) it covers, the territory of Canada Economic Development for Quebec Regions' (CED's) Abitibi-Témiscamingue and Nord-du-Québec Business Office (BO) and the territories served by neighbouring BOs.
Bas-Saint-Laurent administrative region
| Key Economic Indicators | Bas-Saint-Laurent | Quebec as a whole | |
|---|---|---|---|
| Demographics | Population. 2018 | 197 384 | 8 390 499 |
| Share of the total population of Quebec | 2.4% | 100% | |
| Growth from 2013 to 2018 | -1.4% | 3.4% | |
| Proportion of women | 49.9% | 50.1% | |
| By age group. 2018 | |||
| 0-24 | 23.3% | 26.8% | |
| 25-64 | 51.7% | 54.3% | |
| 65 and over | 25% | 18.8% | |
| Aboriginal identity population, 2016 | 3 535 | 182 885 | |
| First Nation | 1 085 | 92 655 | |
| Métis | 2 140 | 69 360 | |
| Inuit | 35 | 13 945 | |
| Labour market | Jobs, 2018 (thousands) | 91 | 4 262 |
| Share of the Quebec total | 2.1% | 100% | |
| Growth from 2013 to 2018 | 2.6% | 5% | |
| Unemployment rate, 2018 | 5.4% | 5.5% | |
| Participation rate, 2018 | 57.3% | 64.6% | |
| Employment rate, 2018 | 54.3% | 61% | |
| Vacant positions, 2019/Q1 | 2 065 | 114 215 | |
| Share of the Quebec total | 1.8% | 100% | |
| Growth from 2018/Q1 to 2019/Q1 | 24.8% | 23% | |
| Production | GDP, 2017 (billions $) | 7 | 385 |
| Share of the Quebec total | 1.9% | 100% | |
| Growth from 2012 to 2017 | 14.4% | 17.5% | |
| GDP per capita, 2017 | $37 474 | $46 392 | |
| Disposable income per capita, 2017 | $26 339 | $28 785 | |
| Industrial structure | Sector breakdown by jobs, 2018 | ||
| Goods-producing sector | 22.6% | 20.2% | |
| - Manufacturing | 9% | 11.5% | |
| Service sector | 77.4% | 79.8% | |
| Number of SMEs, December 2018 | 7 736 | 260 367 | |
| Share of the Quebec total | 3% | 100% | |
| Number of SMEs in manufacturing, December 2018 | 360 | 13 493 | |
| Share of the Quebec total | 3% | 100% | |
| Private investment, 2019 (millions $) | 380 | 20 554 | |
| Share of the Quebec total | 1.9% | 100% | |
| Growth from 2018 to 2019 | -3.6% | 10.6% | |
| Business export rate | 16.4% | 29.4% | |
| Advanced technology utilization rate, 2014 | 59.6% | 62.4% | |
| 2014 ranking among the 17 ARs | 14 | N/A | |
| Business climate | Number of devitalized RCMs according to the 2016 EDI | 8 out of 8 | 71 out of 104 |
| Entrepreneurship rate | 2.4% | 2.4% | |
| Number of universities | 1 | 17 | |
| Number of CEGEPs | 4 | 77 | |
| Number of CCTTs | 7 | 59 | |
| Name and rank (out of 125) of entrepreneurial cities as per CFIB, 2018 | Rimouski (4) and Rivière-du-Loup (5) | N/A | |
Made up of 8 RCMs: La Matapédia, La Matanie, La Mitis, Rimouski-Neigette, Les Basques, Rivière-du-Loup, Témiscouata and Kamouraska
Sources: Institut de la statistique du Québec, Statistics Canada, Centre de recherche industrielle du Québec (and CED's calculations), Ministère de l'Éducation et de l'Enseignement supérieur, Ministère de l'Économie et de l'Innovation, Wikipedia and the Canadian Federation of Independent Business
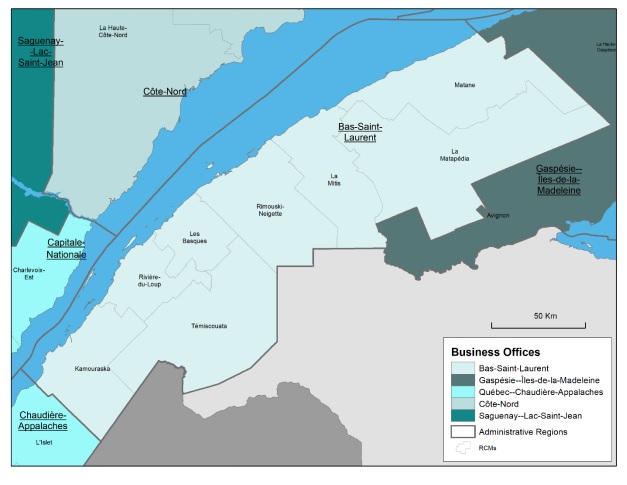
Map Description
Map of the Bas-Saint-Laurent administrative region, the regional county municipalities (RCMs) it covers, the territory of Canada Economic Development for Quebec Regions' (CED's) Bas-Saint-Laurent Business Office (BO) and the territories served by neighbouring BOs.
Capitale-Nationale
| Key Economic Indicators | Capitale-Nationale | Quebec as a whole | |
|---|---|---|---|
| Demographics | Population. 2018 | 745 135 | 8 390 499 |
| Share of the total population of Quebec | 8.9% | 100% | |
| Growth from 2013 to 2018 | 3.4% | 3.4% | |
| Proportion of women | 50.3% | 50.1% | |
| By age group. 2018 | |||
| 0-24 | 25% | 26.8% | |
| 25-64 | 54.3% | 54.3% | |
| 65 and over | 20.7% | 18.8% | |
| Aboriginal identity population, 2016 | 11 425 | 182 885 | |
| First Nation | 6 035 | 92 655 | |
| Métis | 4 720 | 69 360 | |
| Inuit | 150 | 13 945 | |
| Labour market | Jobs, 2018 (thousands) | 398 | 4 262 |
| Share of the Quebec total | 9.3% | 100% | |
| Growth from 2013 to 2018 | 2.9% | 5% | |
| Unemployment rate, 2018 | 4.1% | 5.5% | |
| Participation rate, 2018 | 66.1% | 64.6% | |
| Employment rate, 2018 | 63.4% | 61% | |
| Vacant positions, 2019/Q1 | 11 865 | 114 215 | |
| Share of the Quebec total | 10.4% | 100% | |
| Growth from 2018/Q1 to 2019/Q1 | 28.3% | 23% | |
| Production | GDP, 2017 (billions $) | 38 | 385 |
| Share of the Quebec total | 9.9% | 100% | |
| Growth from 2012 to 2017 | 15.5% | 17.5% | |
| GDP per capita, 2017 | $51 663 | $46 392 | |
| Disposable income per capita, 2017 | $29 929 | $28 785 | |
| Industrial structure | Sector breakdown by jobs, 2018 | ||
| Goods-producing sector | 14.3% | 20.2% | |
| - Manufacturing | 6.9% | 11.5% | |
| Service sector | 85.7% | 79.8% | |
| Number of SMEs, December 2018 | 21 930 | 260 367 | |
| Share of the Quebec total | 8.4% | 100% | |
| Number of SMEs in manufacturing, December 2018 | 965 | 13 493 | |
| Share of the Quebec total | 7% | 100% | |
| Private investment, 2019 (millions $) | 1 686 | 20 554 | |
| Share of the Quebec total | 8.2% | 100% | |
| Growth from 2018 to 2019 | 5.5% | 10.6% | |
| Business export rate | 22% | 29.4% | |
| Advanced technology utilization rate, 2014 | 62.9% | 62.4% | |
| 2014 ranking among the 17 ARs | 2 | N/A | |
| Business climate | Number of devitalized RCMs according to the 2016 EDI | 6 out of 7 | 71 out of 104 |
| Entrepreneurship rate | 2.1% | 2.4% | |
| Number of universities | 3 | 17 | |
| Number of CEGEPs | 10 | 77 | |
| Number of CCTTs | 4 | 59 | |
| Name and rank (out of 125) of entrepreneurial cities as per CFIB, 2018 | Québec (69) | N/A | |
Made up of 7 RCMs: Charlevoix-Est, Charlevoix, L'Île-d'Orléans, La Côte-de-Beaupré, La Jacques-Cartier, Québec and Portneuf
Sources: Institut de la statistique du Québec, Statistics Canada, Centre de recherche industrielle du Québec (and CED's calculations), Ministère de l'Éducation et de l'Enseignement supérieur, Ministère de l'Économie et de l'Innovation, Wikipedia and the Canadian Federation of Independent Business
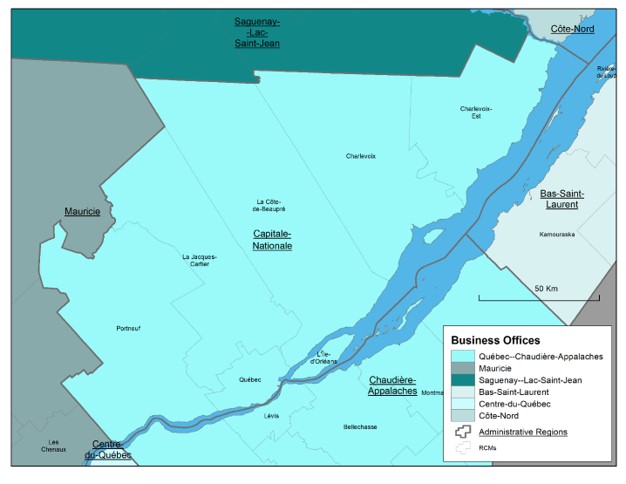
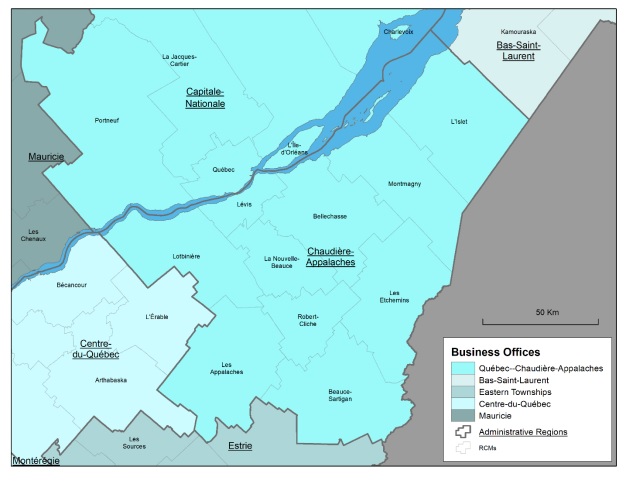
Map Description
Map of the Capitale-Nationale administrative region, the regional county municipalities (RCMs) it covers, the territory of Canada Economic Development for Quebec Regions' (CED's) Capitale-Nationale Business Office (BO) and the territories served by neighbouring BOs.
Centre-du-Québec
| Key Economic Indicators | Centre-du-Québec | Quebec as a whole | |
|---|---|---|---|
| Demographics | Population. 2018 | 247 333 | 8 390 499 |
| Share of the total population of Quebec | 2.9% | 100% | |
| Growth from 2013 to 2018 | 3.4% | 3.4% | |
| Proportion of women | 49.4% | 50.1% | |
| By age group. 2018 | |||
| 0-24 | 26.3% | 26.8% | |
| 25-64 | 52.2% | 54.3% | |
| 65 and over | 21.5% | 18.8% | |
| Aboriginal identity population, 2016 | 2 940 | 182 885 | |
| First Nation | 1 685 | 92 655 | |
| Métis | 1 075 | 69 360 | |
| Inuit | 45 | 13 945 | |
| Labour market | Jobs, 2018 (thousands) | 117 | 4 262 |
| Share of the Quebec total | 2.7% | 100% | |
| Growth from 2013 to 2018 | 4.8% | 5% | |
| Unemployment rate, 2018 | 5.5% | 5.5% | |
| Participation rate, 2018 | 61% | 64.6% | |
| Employment rate, 2018 | 57.6% | 61% | |
| Vacant positions, 2019/Q1 | 3 405 | 114 215 | |
| Share of the Quebec total | 3% | 100% | |
| Growth from 2018/Q1 to 2019/Q1 | 29.2% | 23% | |
| Production | GDP, 2017 (billions $) | 10 | 385 |
| Share of the Quebec total | 2.5% | 100% | |
| Growth from 2012 to 2017 | 16.1% | 17.5% | |
| GDP per capita, 2017 | $38 767 | $46 392 | |
| Disposable income per capita, 2017 | $26 514 | $28 785 | |
| Industrial structure | Sector breakdown by jobs, 2018 | ||
| Goods-producing sector | 35.1% | 20.2% | |
| - Manufacturing | 23.2% | 11.5% | |
| Service sector | 64.9% | 79.8% | |
| Number of SMEs, December 2018 | 8 825 | 260 367 | |
| Share of the Quebec total | 3.4% | 100% | |
| Number of SMEs in manufacturing, December 2018 | 747 | 13 493 | |
| Share of the Quebec total | 6% | 100% | |
| Private investment, 2019 (millions $) | 513 | 20 554 | |
| Share of the Quebec total | 2.5% | 100% | |
| Growth from 2018 to 2019 | 13.4% | 10.6% | |
| Business export rate | 26.8% | 29.4% | |
| Advanced technology utilization rate, 2014 | 62.8% | 62.4% | |
| 2014 ranking among the 17 ARs | 3 | N/A | |
| Business climate | Number of devitalized RCMs according to the 2016 EDI | 2 out of 5 | 71 out of 104 |
| Entrepreneurship rate | 2.9% | 2.4% | |
| Number of universities | 0 | 17 | |
| Number of CEGEPs | 3 | 77 | |
| Number of CCTTs | 4 | 59 | |
| Name and rank (out of 125) of entrepreneurial cities as per CFIB, 2018 | Victoriaville (3) and Drummondville (18) | N/A | |
Made up of 5 RCMs: L'Érable, Bécancour, Arthabaska, Drummond and Nicolet-Yamaska
Sources: Institut de la statistique du Québec, Statistics Canada, Centre de recherche industrielle du Québec (and CED's calculations), Ministère de l'Éducation et de l'Enseignement supérieur, Ministère de l'Économie et de l'Innovation, Wikipedia and the Canadian Federation of Independent Business
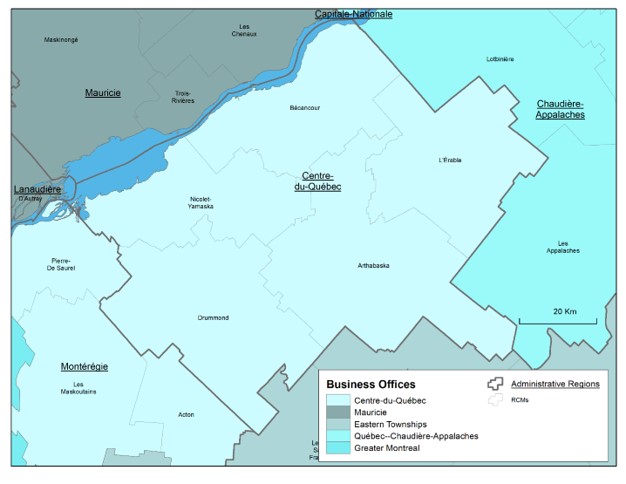
Map Description
Map of the Centre-du-Québec administrative region, the regional county municipalities (RCMs) it covers, the territory of Canada Economic Development for Quebec Regions' (CED's) Centre-du-Québec Business Office (BO) and the territories served by neighbouring BOs.
Chaudière-Appalaches
| Key Economic Indicators | Chaudière-Appalaches | Quebec as a whole | |
|---|---|---|---|
| Demographics | Population 2018 | 426 130 | 8 390 499 |
| Share of the total population of Quebec | 5.1% | 100% | |
| Growth from 2013 to 2018 | 2.1% | 3.4% | |
| Proportion of women | 49.3% | 50.1% | |
| By age group. 2018 | |||
| 0-24 | 26.1% | 26.8% | |
| 25-64 | 52.7% | 54.3% | |
| 65 and over | 21.2% | 18.8% | |
| Aboriginal identity population, 2016 | 4 065 | 182 885 | |
| First Nation | 1 785 | 92 655 | |
| Métis | 1 925 | 69 360 | |
| Inuit | 55 | 13 945 | |
| Labour market | Jobs, 2018 (thousands) | 220 | 4 262 |
| Share of the Quebec total | 5.2% | 100% | |
| Growth from 2013 to 2018 | 0.7% | 5% | |
| Unemployment rate, 2018 | 3.3% | 5.5% | |
| Participation rate, 2018 | 64.6% | 64.6% | |
| Employment rate, 2018 | 62.5% | 61% | |
| Vacant positions, 2019/Q1 | 6 710 | 114 215 | |
| Share of the Quebec total | 5.9% | 100% | |
| Growth from 2018/Q1 to 2019/Q1 | 37.2% | 23% | |
| Production | GDP, 2017 (billions $) | 18 | 385 |
| Share of the Quebec total | 4.7% | 100% | |
| Growth from 2012 to 2017 | 27.9% | 17.5% | |
| GDP per capita, 2017 | $42 814 | $46 392 | |
| Disposable income per capita, 2017 | $28 025 | $28 785 | |
| Industrial structure | Sector breakdown by jobs, 2018 | ||
| Goods-producing sector | 31.4% | 20.2% | |
| - Manufacturing | 18.6% | 11.5% | |
| Service sector | 68.6% | 79.8% | |
| Number of SMEs, December 2018 | 14 901 | 260 367 | |
| Share of the Quebec total | 5.7% | 100% | |
| Number of SMEs in manufacturing, December 2018 | 1 047 | 13 493 | |
| Share of the Quebec total | 8% | 100% | |
| Private investment, 2019 (millions $) | 1 004 | 20 554 | |
| Share of the Quebec total | 4.9% | 100% | |
| Growth from 2018 to 2019 | 10.3% | 10.6% | |
| Business export rate | 23.4% | 29.4% | |
| Advanced technology utilization rate, 2014 | 61.9% | 62.4% | |
| 2014 ranking among the 17 ARs | 11 | N/A | |
| Business climate | Number of devitalized RCMs according to the 2016 EDI | 6 out of 10 | 71 out of 104 |
| Entrepreneurship rate | 2.8% | 2.4% | |
| Number of universities | 0 | 17 | |
| Number of CEGEPs | 3 | 77 | |
| Number of CCTTs | 5 | 59 | |
| Name and rank (out of 125) of entrepreneurial cities as per CFIB, 2018 | Saint-Georges (2) and Thetford Mines (32) | N/A | |
Made up of 10 RCMs: L'Islet, Montmagny, Bellechasse, Lévis, La Nouvelle-Beauce, Robert-Cliche, Les Etchemins, Beauce-Sartigan, Les Appalaches and Lotbinière
Sources: Institut de la statistique du Québec, Statistics Canada, Centre de recherche industrielle du Québec (and CED's calculations), Ministère de l'Éducation et de l'Enseignement supérieur, Ministère de l'Économie et de l'Innovation, Wikipedia and the Canadian Federation of Independent Business
Map Description
Map of the Chaudière-Appalaches administrative region, the regional county municipalities (RCMs) it covers, the territory of Canada Economic Development for Quebec Regions' (CED's) Chaudière-Appalaches Business Office (BO) and the territories served by neighbouring BOs.
Côte-Nord
| Key Economic Indicators | Côte-Nord | Quebec as a whole | |
|---|---|---|---|
| Demographics | Population. 2018 | 91 213 | 8 390 499 |
| Share of the total population of Quebec | 1.1% | 100% | |
| Growth from 2013 to 2018 | -4.7% | 3.4% | |
| Proportion of women | 49.1% | 50.1% | |
| By age group. 2018 | |||
| 0-24 | 26.5% | 26.8% | |
| 25-64 | 54.7% | 54.3% | |
| 65 and over | 18.8% | 18.8% | |
| Aboriginal identity population, 2016 | 16 455 | 182 885 | |
| First Nation | 11 145 | 92 655 | |
| Métis | 4 795 | 69 360 | |
| Inuit | 235 | 13 945 | |
| Labour market | Jobs, 2018 (thousands) | 55 | 4 262 |
| Share of the Quebec total | 1.3% | 100% | |
| Growth from 2013 to 2018 | 2.8% | 5% | |
| Unemployment rate, 2018 | 4.9% | 5.5% | |
| Participation rate, 2018 | 63.6% | 64.6% | |
| Employment rate, 2018 | 60.4% | 61% | |
| Vacant positions, 2019/Q1 | 2 040 | 114 215 | |
| Share of the Quebec total | 1.8% | 100% | |
| Growth from 2018/Q1 to 2019/Q1 | 22.5% | 23% | |
| Production | GDP, 2017 (billions $) | 6 | 385 |
| Share of the Quebec total | 1.6% | 100% | |
| Growth from 2012 to 2017 | -15.8% | 17.5% | |
| GDP per capita, 2017 | $67 773 | $46 392 | |
| Disposable income per capita, 2017 | $28 480 | $28 785 | |
| Industrial structure | Sector breakdown by jobs, 2018 | ||
| Goods-producing sector | 30.1% | 20.2% | |
| - Manufacturing | 11.2% | 11.5% | |
| Service sector | 70.1% | 79.8% | |
| Number of SMEs, December 2018 | 2 856 | 260 367 | |
| Share of the Quebec total | 1.1% | 100% | |
| Number of SMEs in manufacturing, December 2018 | 84 | 13 493 | |
| Share of the Quebec total | 1% | 100% | |
| Private investment, 2019 (millions $) | 561 | 20 554 | |
| Share of the Quebec total | 2.7% | 100% | |
| Growth from 2018 to 2019 | -5.3% | 10.6% | |
| Business export rate | 13.1% | 29.4% | |
| Advanced technology utilization rate, 2014 | 59.9% | 62.4% | |
| 2014 ranking among the 17 ARs | 13 | N/A | |
| Business climate | Number of devitalized RCMs according to the 2016 EDI | 6 out of 6 | 71 out of 104 |
| Entrepreneurship rate | 1.5% | 2.4% | |
| Number of universities | 0 | 17 | |
| Number of CEGEPs | 2 | 77 | |
| Number of CCTTs | 2 | 59 | |
| Name and rank (out of 125) of entrepreneurial cities as per CFIB, 2018 | Baie-Comeau (21) and Sept-Îles (109) | N/A | |
Made up of 6 RCMs: La Haute-Côte-Nord, Manicouagan, Sept-Rivières, Caniapiscau, Minganie and Le Golfe-du-Saint-Laurent
Sources: Institut de la statistique du Québec, Statistics Canada, Centre de recherche industrielle du Québec (and CED's calculations), Ministère de l'Éducation et de l'Enseignement supérieur, Ministère de l'Économie et de l'Innovation, Wikipedia and the Canadian Federation of Independent Business
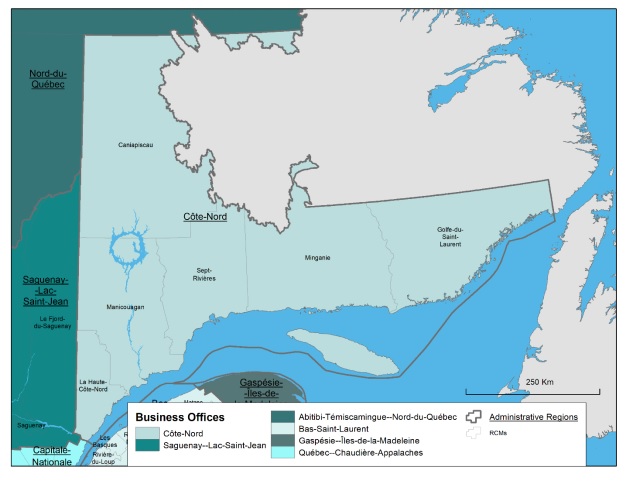
Map Description
Map of the Côte-Nord administrative region, the regional county municipalities (RCMs) it covers, the territory of Canada Economic Development for Quebec Regions' (CED's) Côte-Nord Business Office (BO) and the territories served by neighbouring BOs.
Estrie
| Key Economic Indicators | Estrie | Quebec as a whole | |
|---|---|---|---|
| Demographics | Population. 2018 | 326 476 | 8 390 499 |
| Share of the total population of Quebec | 3.9% | 100% | |
| Growth from 2013 to 2018 | 3.3% | 3.4% | |
| Proportion of women | 49.8% | 50.1% | |
| By age group. 2018 | |||
| 0-24 | 26.7% | 26.8% | |
| 25-64 | 51.8% | 54.3% | |
| 65 and over | 21.5% | 18.8% | |
| Aboriginal identity population, 2016 | 4 045 | 182 885 | |
| First Nation | 1 785 | 92 655 | |
| Métis | 1 935 | 69 360 | |
| Inuit | 95 | 13 945 | |
| Labour market | Jobs, 2018 (thousands) | 162 | 4 262 |
| Share of the Quebec total | 3.8% | 100% | |
| Growth from 2013 to 2018 | 3.9% | 5% | |
| Unemployment rate, 2018 | 4.7% | 5.5% | |
| Participation rate, 2018 | 61.7% | 64.6% | |
| Employment rate, 2018 | 58.8% | 61% | |
| Vacant positions, 2019/Q1 | 4 150 | 114 215 | |
| Share of the Quebec total | 3.6% | 100% | |
| Growth from 2018/Q1 to 2019/Q1 | 16.1% | 23% | |
| Production | GDP, 2017 (billions $) | 12 | 385 |
| Share of the Quebec total | 3.1% | 100% | |
| Growth from 2012 to 2017 | 16.2% | 17.5% | |
| GDP per capita, 2017 | $37 378 | $46 392 | |
| Disposable income per capita, 2017 | $27 507 | $28 785 | |
| Industrial structure | Sector breakdown by jobs, 2018 | ||
| Goods-producing sector | 28.2% | 20.2% | |
| - Manufacturing | 17.7% | 11.5% | |
| Service sector | 71.8% | 79.8% | |
| Number of SMEs, December 2018 | 10 036 | 260 367 | |
| Share of the Quebec total | 3.9% | 100% | |
| Number of SMEs in manufacturing, December 2018 | 695 | 13 493 | |
| Share of the Quebec total | 5% | 100% | |
| Private investment, 2019 (millions $) | 685 | 20 554 | |
| Share of the Quebec total | 3.3% | 100% | |
| Growth from 2018 to 2019 | 12.8% | 10.6% | |
| Business export rate | 30.1% | 29.4% | |
| Advanced technology utilization rate, 2014 | 62.4% | 62.4% | |
| 2014 ranking among the 17 ARs | 7 | N/A | |
| Business climate | Number of devitalized RCMs according to the 2016 EDI | 5 out of 7 | 71 out of 104 |
| Entrepreneurship rate | 2.6% | 2.4% | |
| Number of universities | 2 | 17 | |
| Number of CEGEPs | 3 | 77 | |
| Number of CCTTs | 1 | 59 | |
| Name and rank (out of 125) of entrepreneurial cities as per CFIB, 2018 | Sherbrooke (19) | N/A | |
Made up of 7 RCMs: Le Granit, Les Sources, Le Haut-Saint-François, Le Val-Saint-François, Sherbrooke, Coaticook and Memphrémagog
Sources: Institut de la statistique du Québec, Statistics Canada, Centre de recherche industrielle du Québec (and CED's calculations), Ministère de l'Éducation et de l'Enseignement supérieur, Ministère de l'Économie et de l'Innovation, Wikipedia and the Canadian Federation of Independent Business
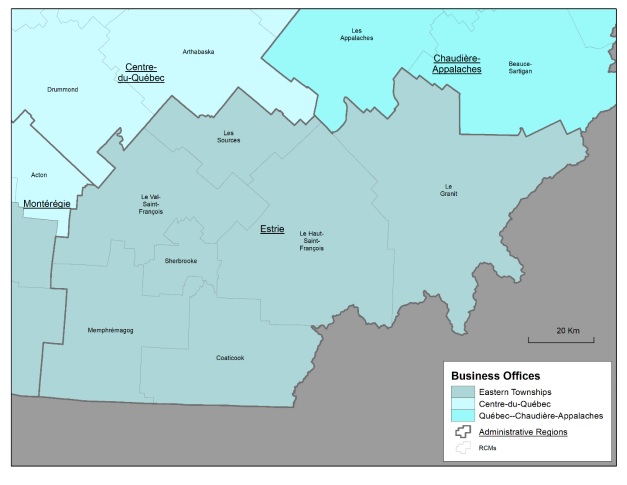
Map Description
Map of the Estrie administrative region, the regional county municipalities (RCMs) it covers, the territory of Canada Economic Development for Quebec Regions' (CED's) Cantons-de-l'Est Business Office (BO) and the territories served by neighbouring BOs.
Gaspésie–Îles-de-la-Madeleine
| Key Economic Indicators | Gaspésie–Îles-de-la-Madeleine | Quebec as a whole | |
|---|---|---|---|
| Demographics | Population. 2018 | 90 709 | 8 390 499 |
| Share of the total population of Quebec | 1.1% | 100% | |
| Growth from 2013 to 2018 | -2.6% | 3.4% | |
| Proportion of women | 50.4% | 50.1% | |
| By age group. 2018 | |||
| 0-24 | 20.5% | 26.8% | |
| 25-64 | 53% | 54.3% | |
| 65 and over | 26.5% | 18.8% | |
| Aboriginal identity population, 2016 | 8 745 | 182 885 | |
| First Nation | 2 630 | 92 655 | |
| Métis | 5 725 | 69 360 | |
| Inuit | 70 | 13 945 | |
| Labour market | Jobs, 2018 (thousands) | 34 | 4 262 |
| Share of the Quebec total | 0.8% | 100% | |
| Growth from 2013 to 2018 | -5% | 5% | |
| Unemployment rate, 2018 | 12.9% | 5.5% | |
| Participation rate, 2018 | 51.8% | 64.6% | |
| Employment rate, 2018 | 45.1% | 61% | |
| Vacant positions, 2019/Q1 | 600 | 114 215 | |
| Share of the Quebec total | 0.5% | 100% | |
| Growth from 2018/Q1 to 2019/Q1 | -18.9% | 23% | |
| Production | GDP, 2017 (billions $) | 3 | 385 |
| Share of the Quebec total | 0.8% | 100% | |
| Growth from 2012 to 2017 | 22.3% | 17.5% | |
| GDP per capita, 2017 | $35 524 | $46 392 | |
| Disposable income per capita, 2017 | $26 832 | $28 785 | |
| Industrial structure | Sector breakdown by jobs, 2018 | ||
| Goods-producing sector | 22.7% | 20.2% | |
| - Manufacturing | 7.8% | 11.5% | |
| Service sector | 77.3% | 79.8% | |
| Number of SMEs, December 2018 | 3 877 | 260 367 | |
| Share of the Quebec total | 1.5% | 100% | |
| Number of SMEs in manufacturing, December 2018 | 145 | 13 493 | |
| Share of the Quebec total | 1% | 100% | |
| Private investment, 2019 (millions $) | 107 | 20 554 | |
| Share of the Quebec total | 0.5% | 100% | |
| Growth from 2018 to 2019 | 13.8% | 10.6% | |
| Business export rate | 15.5% | 29.4% | |
| Advanced technology utilization rate, 2014 | 59.5% | 62.4% | |
| 2014 ranking among the 17 ARs | 15 | N/A | |
| Business climate | Number of devitalized RCMs according to the 2016 EDI | 6 out of 6 | 71 out of 104 |
| Entrepreneurship rate | 2.1% | 2.4% | |
| Number of universities | 0 | 17 | |
| Number of CEGEPs | 1 | 77 | |
| Number of CCTTs | 3 | 59 | |
| Name and rank (out of 125) of entrepreneurial cities as per CFIB, 2018 | N/A | ||
Made up of 6 RCMs: Les Îles-de-la-Madeleine, Le Rocher-Percé, La Côte-de-Gaspé, La Haute-Gaspésie, Bonaventure and Avignon
Sources: Institut de la statistique du Québec, Statistics Canada, Centre de recherche industrielle du Québec (and CED's calculations), Ministère de l'Éducation et de l'Enseignement supérieur, Ministère de l'Économie et de l'Innovation, Wikipedia and the Canadian Federation of Independent Business
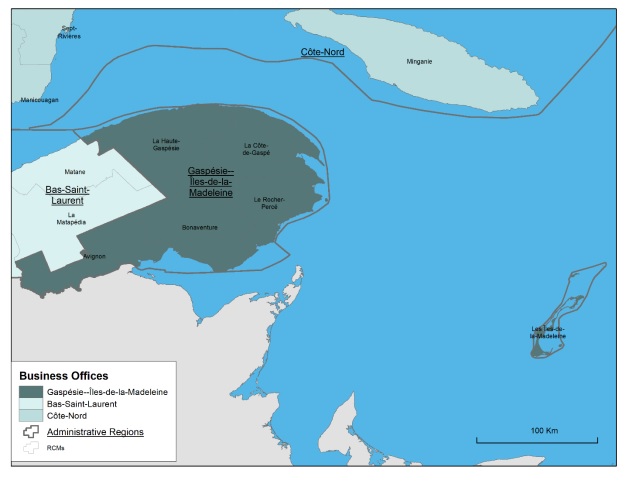
Map Description
Map of the Gaspésie–Îles-de-la-Madeleine administrative region, the regional county municipalities (RCMs) it covers, the territory of Canada Economic Development for Quebec Regions' (CED's) Gaspésie–Îles-de-la-Madeleine Business Office (BO) and the territories served by neighbouring BOs.
Lanaudière
| Key Economic Indicators | Lanaudière | Quebec as a whole | |
|---|---|---|---|
| Demographics | Population. 2018 | 507 947 | 8 390 499 |
| Share of the total population of Quebec | 6.1% | 100% | |
| Growth from 2013 to 2018 | 4.2% | 3.4% | |
| Proportion of women | 49.8% | 50.1% | |
| By age group. 2018 | |||
| 0-24 | 27.6% | 26.8% | |
| 25-64 | 54.3% | 54.3% | |
| 65 and over | 18% | 18.8% | |
| Aboriginal identity population, 2016 | 8 175 | 182 885 | |
| First Nation | 4 800 | 92 655 | |
| Métis | 2 965 | 69 360 | |
| Inuit | 35 | 13 945 | |
| Labour market | Jobs, 2018 (thousands) | 252 | 4 262 |
| Share of the Quebec total | 5.9% | 100% | |
| Growth from 2013 to 2018 | 2.8% | 5% | |
| Unemployment rate, 2018 | 5.8% | 5.5% | |
| Participation rate, 2018 | 63.6% | 64.6% | |
| Employment rate, 2018 | 59.9% | 61% | |
| Vacant positions, 2019/Q1 | 4 225 | 114 215 | |
| Share of the Quebec total | 3.7% | 100% | |
| Growth from 2018/Q1 to 2019/Q1 | 17.5% | 23% | |
| Production | GDP, 2017 (billions $) | 14 | 385 |
| Share of the Quebec total | 3.6% | 100% | |
| Growth from 2012 to 2017 | 19.8% | 17.5% | |
| GDP per capita, 2017 | $27 630 | $46 392 | |
| Disposable income per capita, 2017 | $27 910 | $28 785 | |
| Industrial structure | Sector breakdown by jobs, 2018 | ||
| Goods-producing sector | 21.9% | 20.2% | |
| - Manufacturing | 12.8% | 11.5% | |
| Service sector | 78.1% | 79.8% | |
| Number of SMEs, December 2018 | 14 993 | 260 367 | |
| Share of the Quebec total | 5.8% | 100% | |
| Number of SMEs in manufacturing, December 2018 | 814 | 13 493 | |
| Share of the Quebec total | 6% | 100% | |
| Private investment, 2019 (millions $) | 466 | 20 554 | |
| Share of the Quebec total | 2.3% | 100% | |
| Growth from 2018 to 2019 | 11% | 10.6% | |
| Business export rate | 21.6% | 29.4% | |
| Advanced technology utilization rate, 2014 | 62.3% | 62.4% | |
| 2014 ranking among the 17 ARs | 8 | N/A | |
| Business climate | Number of devitalized RCMs according to the 2016 EDI | 4 out of 6 | 71 out of 104 |
| Entrepreneurship rate | 2.7% | 2.4% | |
| Number of universities | 0 | 17 | |
| Number of CEGEPs | 1 | 77 | |
| Number of CCTTs | 1 | 59 | |
| Name and rank (out of 125) of entrepreneurial cities as per CFIB, 2018 | Joliette (25) | N/A | |
Made up of 6 RCMs: D'Autray, L'Assomption, Joliette, Matawinie, Montcalm and Les Moulins
Sources: Institut de la statistique du Québec, Statistics Canada, Centre de recherche industrielle du Québec (and CED's calculations), Ministère de l'Éducation et de l'Enseignement supérieur, Ministère de l'Économie et de l'Innovation, Wikipedia and the Canadian Federation of Independent Business
Map Description
Map of the Lanaudière administrative region, the regional county municipalities (RCMs) it covers, the territory of Canada Economic Development for Quebec Regions' (CED's) Business Office (BO) serving the Lanaudière region and the territories served by neighbouring BOs.
Laurentides
| Key Economic Indicators | Laurentides | Quebec as a whole | |
|---|---|---|---|
| Demographics | Population. 2018 | 611 019 | 8 390 499 |
| Share of the total population of Quebec | 7.3% | 100% | |
| Growth from 2013 to 2018 | 5.7% | 3.4% | |
| Proportion of women | 49.9% | 50.1% | |
| By age group. 2018 | |||
| 0-24 | 26.8% | 26.8% | |
| 25-64 | 54.9% | 54.3% | |
| 65 and over | 18.3% | 18.8% | |
| Aboriginal identity population, 2016 | 9 810 | 182 885 | |
| First Nation | 3 775 | 92 655 | |
| Métis | 5 425 | 69 360 | |
| Inuit | 110 | 13 945 | |
| Labour market | Jobs, 2018 (thousands) | 310 | 4 262 |
| Share of the Quebec total | 7.3% | 100% | |
| Growth from 2013 to 2018 | 0.9% | 5% | |
| Unemployment rate, 2018 | 5.6% | 5.5% | |
| Participation rate, 2018 | 64.3% | 64.6% | |
| Employment rate, 2018 | 60.7% | 61% | |
| Vacant positions, 2019/Q1 | 5 830 | 114 215 | |
| Share of the Quebec total | 5.1% | 100% | |
| Growth from 2018/Q1 to 2019/Q1 | 57.1% | 23% | |
| Production | GDP, 2017 (billions $) | 21 | 385 |
| Share of the Quebec total | 5.5% | 100% | |
| Growth from 2012 to 2017 | 21.6% | 17.5% | |
| GDP per capita, 2017 | $35 155 | $46 392 | |
| Disposable income per capita, 2017 | $29 472 | $28 785 | |
| Industrial structure | Sector breakdown by jobs, 2018 | ||
| Goods-producing sector | 22.4% | 20.2% | |
| - Manufacturing | 10.6% | 11.5% | |
| Service sector | 77.6% | 79.8% | |
| Number of SMEs, December 2018 | 18 984 | 260 367 | |
| Share of the Quebec total | 7.3% | 100% | |
| Number of SMEs in manufacturing, December 2018 | 906 | 13 493 | |
| Share of the Quebec total | 7% | 100% | |
| Private investment, 2019 (millions $) | 636 | 20 554 | |
| Share of the Quebec total | 3.1% | 100% | |
| Growth from 2018 to 2019 | -4.8% | 10.6% | |
| Business export rate | 25.6% | 29.4% | |
| Advanced technology utilization rate, 2014 | 62.5% | 62.4% | |
| 2014 ranking among the 17 ARs | 5 | N/A | |
| Business climate | Number of devitalized RCMs according to the 2016 EDI | 4 out of 8 | 71 out of 104 |
| Entrepreneurship rate | 2.8% | 2.4% | |
| Number of universities | 0 | 17 | |
| Number of CEGEPs | 2 | 77 | |
| Number of CCTTs | 3 | 59 | |
| Name and rank (out of 125) of entrepreneurial cities as per CFIB, 2018 | N/A | ||
Made up of 8 RCMs: Deux-Montagnes, Thérèse-De Blainville, Mirabel, La Rivière-du-Nord, Argenteuil, Les Pays-d'en-Haut, Les Laurentides and Antoine-Labelle
Sources: Institut de la statistique du Québec, Statistics Canada, Centre de recherche industrielle du Québec (and CED's calculations), Ministère de l'Éducation et de l'Enseignement supérieur, Ministère de l'Économie et de l'Innovation, Wikipedia and the Canadian Federation of Independent Business
Map Description
Map of the Laurentides administrative region, the regional county municipalities (RCMs) it covers, the territory of Canada Economic Development for Quebec Regions' (CED's) Business Office (BO) serving the Laurentides region and the territories served by neighbouring BOs.
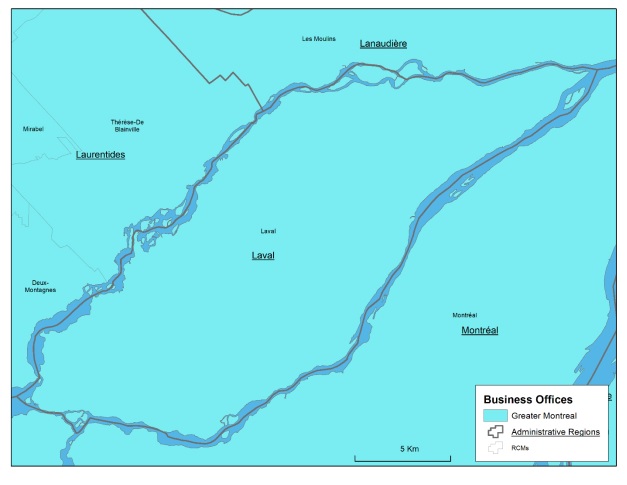
Laval
| Key Economic Indicators | Laval | Quebec as a whole | |
|---|---|---|---|
| Demographics | Population. 2018 | 432 858 | 8 390 499 |
| Share of the total population of Quebec | 5.2% | 100% | |
| Growth from 2013 to 2018 | 4% | 3.4% | |
| Proportion of women | 50.7% | 50.1% | |
| By age group. 2018 | |||
| 0-24 | 28.9% | 26.8% | |
| 25-64 | 53.8% | 54.3% | |
| 65 and over | 17.4% | 18.8% | |
| Aboriginal identity population, 2016 | 2 530 | 182 885 | |
| First Nation | 1 145 | 92 655 | |
| Métis | 1 170 | 69 360 | |
| Inuit | 30 | 13 945 | |
| Labour market | Jobs, 2018 (thousands) | 237 | 4 262 |
| Share of the Quebec total | 5.6% | 100% | |
| Growth from 2013 to 2018 | 7.1% | 5% | |
| Unemployment rate, 2018 | 5.3% | 5.5% | |
| Participation rate, 2018 | 68.9% | 64.6% | |
| Employment rate, 2018 | 65.3% | 61% | |
| Vacant positions, 2019/Q1 | 4 610 | 114 215 | |
| Share of the Quebec total | 4% | 100% | |
| Growth from 2018/Q1 to 2019/Q1 | 37.4% | 23% | |
| Production | GDP, 2017 (billions $) | 16 | 385 |
| Share of the Quebec total | 4.1% | 100% | |
| Growth from 2012 to 2017 | 18.7% | 17.5% | |
| GDP per capita, 2017 | $36 812 | $46 392 | |
| Disposable income per capita, 2017 | $28 277 | $28 785 | |
| Industrial structure | Sector breakdown by jobs, 2018 | ||
| Goods-producing sector | 18.2% | 20.2% | |
| - Manufacturing | 11.7% | 11.5% | |
| Service sector | 81.8% | 79.8% | |
| Number of SMEs, December 2018 | 12 255 | 260 367 | |
| Share of the Quebec total | 4.7% | 100% | |
| Number of SMEs in manufacturing, December 2018 | 579 | 13 493 | |
| Share of the Quebec total | 4% | 100% | |
| Private investment, 2019 (millions $) | 533 | 20 554 | |
| Share of the Quebec total | 2.6% | 100% | |
| Growth from 2018 to 2019 | -3.9% | 10.6% | |
| Business export rate | 29.3% | 29.4% | |
| Advanced technology utilization rate, 2014 | 62.4% | 62.4% | |
| 2014 ranking among the 17 ARs | 6 | N/A | |
| Business climate | Number of devitalized RCMs according to the 2016 EDI | 0 out of 1 | 71 out of 104 |
| Entrepreneurship rate | 2.6% | 2.4% | |
| Number of universities | 0 | 17 | |
| Number of CEGEPs | 1 | 77 | |
| Number of CCTTs | 0 | 59 | |
| Name and rank (out of 125) of entrepreneurial cities as per CFIB, 2018 | N/A | ||
Made up of 1 RCM: Laval
Sources: Institut de la statistique du Québec, Statistics Canada, Centre de recherche industrielle du Québec (and CED's calculations), Ministère de l'Éducation et de l'Enseignement supérieur, Ministère de l'Économie et de l'Innovation, Wikipedia and the Canadian Federation of Independent Business
Map Description
Map of the Laval administrative region, the regional county municipalities (RCMs) it covers, the territory of Canada Economic Development for Quebec Regions' (CED's) Business Office (BO) serving the Laval region and the territories served by neighbouring BOs.
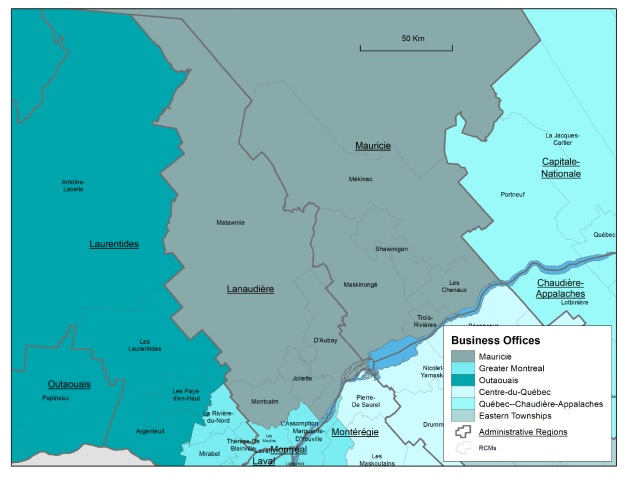
Mauricie
| Key Economic Indicators | Mauricie | Quebec as a whole | |
|---|---|---|---|
| Demographics | Population. 2018 | 269 332 | 8 390 499 |
| Share of the total population of Quebec | 3.2% | 100% | |
| Growth from 2013 to 2018 | 1.3% | 3.4% | |
| Proportion of women | 50.2% | 50.1% | |
| By age group. 2018 | |||
| 0-24 | 23.3% | 26.8% | |
| 25-64 | 52.1% | 54.3% | |
| 65 and over | 24.6% | 18.8% | |
| Aboriginal identity population, 2016 | 7 875 | 182 885 | |
| First Nation | 5 690 | 92 655 | |
| Métis | 1 945 | 69 360 | |
| Inuit | 30 | 13 945 | |
| Labour market | Jobs, 2018 (thousands) | 119 | 4 262 |
| Share of the Quebec total | 2.8% | 100% | |
| Growth from 2013 to 2018 | 8.8% | 5% | |
| Unemployment rate, 2018 | 5.1% | 5.5% | |
| Participation rate, 2018 | 55.6% | 64.6% | |
| Employment rate, 2018 | 52.7% | 61% | |
| Vacant positions, 2019/Q1 | 3 380 | 114 215 | |
| Share of the Quebec total | 3% | 100% | |
| Growth from 2018/Q1 to 2019/Q1 | 89.4% | 23% | |
| Production | GDP, 2017 (billions $) | 10 | 385 |
| Share of the Quebec total | 2.5% | 100% | |
| Growth from 2012 to 2017 | 16.3% | 17.5% | |
| GDP per capita, 2017 | $35 740 | $46 392 | |
| Disposable income per capita, 2017 | $26 243 | $28 785 | |
| Industrial structure | Sector breakdown by jobs, 2018 | ||
| Goods-producing sector | 24.5% | 20.2% | |
| - Manufacturing | 13.2% | 11.5% | |
| Service sector | 75.5% | 79.8% | |
| Number of SMEs, December 2018 | 7 835 | 260 367 | |
| Share of the Quebec total | 3% | 100% | |
| Number of SMEs in manufacturing, December 2018 | 453 | 13 493 | |
| Share of the Quebec total | 3% | 100% | |
| Private investment, 2019 (millions $) | 368 | 20 554 | |
| Share of the Quebec total | 1.8% | 100% | |
| Growth from 2018 to 2019 | -6% | 10.6% | |
| Business export rate | 21.7% | 29.4% | |
| Advanced technology utilization rate, 2014 | 62% | 62.4% | |
| 2014 ranking among the 17 ARs | 10 | N/A | |
| Business climate | Number of devitalized RCMs according to the 2016 EDI | 5 out of 6 | 71 out of 104 |
| Entrepreneurship rate | 2.1% | 2.4% | |
| Number of universities | 1 | 17 | |
| Number of CEGEPs | 4 | 77 | |
| Number of CCTTs | 4 | 59 | |
| Name and rank (out of 125) of entrepreneurial cities as per CFIB, 2018 | Trois-Rivières (20) and Shawinigan (49) | N/A | |
Made up of 6 RCMs: Mékinac, Shawinigan, Trois-Rivières, Les Chenaux Maskinongé and La Tuque
Sources: Institut de la statistique du Québec, Statistics Canada, Centre de recherche industrielle du Québec (and CED's calculations), Ministère de l'Éducation et de l'Enseignement supérieur, Ministère de l'Économie et de l'Innovation, Wikipedia and the Canadian Federation of Independent Business
.jpg)
Map Description
Map of the Mauricie administrative region, the regional county municipalities (RCMs) it covers, the territory of Canada Economic Development for Quebec Regions' (CED's) Mauricie Business Office (BO) and the territories served by neighbouring BOs.
Montérégie
| Key Economic Indicators | Montérégie | Quebec as a whole | |
|---|---|---|---|
| Demographics | Population. 2018 | 1 554 282 | 8 390 499 |
| Share of the total population of Quebec | 18.5% | 100% | |
| Growth from 2013 to 2018 | 4% | 3.4% | |
| Proportion of women | 50.1% | 50.1% | |
| By age group. 2018 | |||
| 0-24 | 27.4% | 26.8% | |
| 25-64 | 53.9% | 54.3% | |
| 65 and over | 18.7% | 18.8% | |
| Aboriginal identity population, 2016 | 17 390 | 182 885 | |
| First Nation | 9 210 | 92 655 | |
| Métis | 6 860 | 69 360 | |
| Inuit | 245 | 13 945 | |
| Labour market | Jobs, 2018 (thousands) | 805 | 4 262 |
| Share of the Quebec total | 18.9% | 100% | |
| Growth from 2013 to 2018 | 4.7% | 5% | |
| Unemployment rate, 2018 | 4.5% | 5.5% | |
| Participation rate, 2018 | 65.9% | 64.6% | |
| Employment rate, 2018 | 62.9% | 61% | |
| Vacant positions, 2019/Q1 | 18 450 | 114 215 | |
| Share of the Quebec total | 16.2% | 100% | |
| Growth from 2018/Q1 to 2019/Q1 | 23% | 23% | |
| Production | GDP, 2017 (billions $) | 59 | 385 |
| Share of the Quebec total | 15.4% | 100% | |
| Growth from 2012 to 2017 | 20.5% | 17.5% | |
| GDP per capita, 2017 | $38 425 | $46 392 | |
| Disposable income per capita, 2017 | $29 741 | $28 785 | |
| Industrial structure | Sector breakdown by jobs, 2018 | ||
| Goods-producing sector | 22.5% | 20.2% | |
| - Manufacturing | 13% | 11.5% | |
| Service sector | 77.5% | 79.8% | |
| Number of SMEs, December 2018 | 45 549 | 260 367 | |
| Share of the Quebec total | 17.5% | 100% | |
| Number of SMEs in manufacturing, December 2018 | 2 488 | 13 493 | |
| Share of the Quebec total | 18% | 100% | |
| Private investment, 2019 (millions $) | 2 868 | 20 554 | |
| Share of the Quebec total | 14% | 100% | |
| Growth from 2018 to 2019 | 8.4% | 10.6% | |
| Business export rate | 31.9% | 29.4% | |
| Advanced technology utilization rate, 2014 | 62.7% | 62.4% | |
| 2014 ranking among the 17 ARs | 4 | N/A | |
| Business climate | Number of devitalized RCMs according to the 2016 EDI | 5 out of 15 | 71 out of 104 |
| Entrepreneurship rate | 2.6% | 2.4% | |
| Number of universities | 0 | 17 | |
| Number of CEGEPs | 7 | 77 | |
| Number of CCTTs | 4 | 59 | |
| Name and rank (out of 125) of entrepreneurial cities as per CFIB, 2018 | Saint-Hyacinthe (12). Granby (42). Salaberry-de-Valleyfield (49) and Sorel-Tracy (114) | N/A | |
Made up of 15 RCMs: Brome-Missisquoi, La Haute-Yamaska, Acton, Pierre-De Saurel, Les Maskoutains, Rouville, Le Haut-Richelieu, La Vallée-du-Richelieu, Longueuil, Marguerite-D'Youville, Roussillon, Les Jardins-de-Napierville, Le Haut-Saint-Laurent, Beauharnois-Salaberry and Vaudreuil-Soulanges
Sources: Institut de la statistique du Québec, Statistics Canada, Centre de recherche industrielle du Québec (and CED's calculations), Ministère de l'Éducation et de l'Enseignement supérieur, Ministère de l'Économie et de l'Innovation, Wikipedia and the Canadian Federation of Independent Business
Map Description
Map of the Montérégie administrative region, the regional county municipalities (RCMs) it covers, the territory of Canada Economic Development for Quebec Regions' (CED's) Business Office (BO) serving the Montérégie region and the territories served by neighbouring BOs.
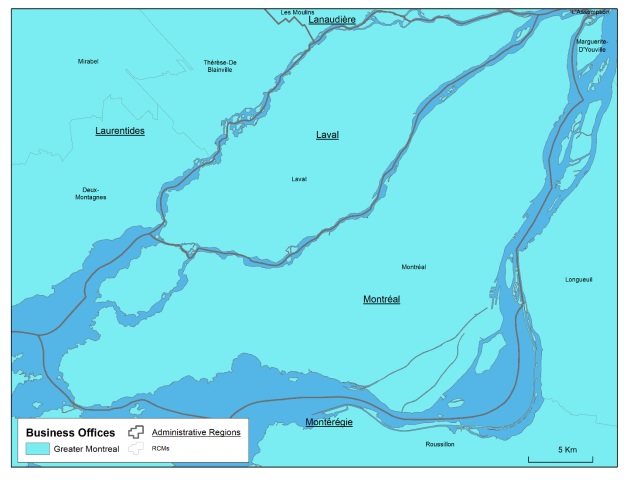
Montréal
| Key Economic Indicators | Montréal | Quebec as a whole | |
|---|---|---|---|
| Demographics | Population. 2018 | 2 029 379 | 8 390 499 |
| Share of the total population of Quebec | 24.2% | 100% | |
| Growth from 2013 to 2018 | 4.7% | 3.4% | |
| Proportion of women | 50.6% | 50.1% | |
| By age group. 2018 | |||
| 0-24 | 27.5% | 26.8% | |
| 25-64 | 56.2% | 54.3% | |
| 65 and over | 16.3% | 18.8% | |
| Aboriginal identity population, 2016 | 13 100 | 182 885 | |
| First Nation | 5 910 | 92 655 | |
| Métis | 5 745 | 69 360 | |
| Inuit | 670 | 13 945 | |
| Labour market | Jobs, 2018 (thousands) | 1 059 | 4 262 |
| Share of the Quebec total | 24.8% | 100% | |
| Growth from 2013 to 2018 | 9.9% | 5.0% | |
| Unemployment rate, 2018 | 7.2% | 5.5% | |
| Participation rate, 2018 | 66.3% | 64.6% | |
| Employment rate, 2018 | 61.6% | 61% | |
| Vacant positions, 2019/Q1 | 38 515 | 114 215 | |
| Share of the Quebec total | 33.7% | 100% | |
| Growth from 2018/Q1 to 2019/Q1 | 16.6% | 23% | |
| Production | GDP, 2017 (billions $) | 134 | 385 |
| Share of the Quebec total | 34.8% | 100% | |
| Growth from 2012 to 2017 | 17.9% | 17.5% | |
| GDP per capita, 2017 | $67 449 | $46 392 | |
| Disposable income per capita, 2017 | $29 612 | $28 785 | |
| Industrial structure | Sector breakdown by jobs, 2018 | ||
| Goods-producing sector | 13.5% | 20.2% | |
| - Manufacturing | 9.9% | 11.5% | |
| Service sector | 86.5% | 79.8% | |
| Number of SMEs, December 2018 | 66 844 | 260 367 | |
| Share of the Quebec total | 25.7% | 100% | |
| Number of SMEs in manufacturing, December 2018 | 3 256 | 13 493 | |
| Share of the Quebec total | 24% | 100% | |
| Private investment, 2019 (millions $) | 6 772 | 20 554 | |
| Share of the Quebec total | 32.9% | 100% | |
| Growth from 2018 to 2019 | 12.1% | 10.6% | |
| Business export rate | 41% | 29.4% | |
| Advanced technology utilization rate, 2014 | 63.5% | 62.4% | |
| 2014 ranking among the 17 ARs | 1 | N/A | |
| Business climate | Number of devitalized RCMs according to the 2016 EDI | 0 out of 1 | 71 out of 104 |
| Entrepreneurship rate | 2.3% | 2.4% | |
| Number of universities | 7 | 17 | |
| Number of CEGEPs | 27 | 77 | |
| Number of CCTTs | 14 | 59 | |
| Name and rank (out of 125) of entrepreneurial cities as per CFIB, 2018 | Montréal (44) | N/A | |
Made up of 1 RCM: Montréal
Sources: Institut de la statistique du Québec, Statistics Canada, Centre de recherche industrielle du Québec (and CED's calculations), Ministère de l'Éducation et de l'Enseignement supérieur, Ministère de l'Économie et de l'Innovation, Wikipedia and the Canadian Federation of Independent Business
Map Description
Map of the Montréal administrative region and the territory of Canada Economic Development for Quebec Regions' (CED's) Business Office (BO) serving Montréal and the territories served by neighbouring BOs.
Nord-du-Québec
| Key Economic Indicators | Nord-du-Québec | Quebec as a whole | |
|---|---|---|---|
| Demographics | Population. 2018 | 45 558 | 8 390 499 |
| Share of the total population of Quebec | 0.5% | 100% | |
| Growth from 2013 to 2018 | 3.9% | 3.4% | |
| Proportion of women | 48.4% | 50.1% | |
| By age group. 2018 | |||
| 0-24 | 42% | 26.8% | |
| 25-64 | 49.8% | 54.3% | |
| 65 and over | 8.2% | 18.8% | |
| Aboriginal identity population, 2016 | 29 290 | 182 885 | |
| First Nation | 16 750 | 92 655 | |
| Métis | 575 | 69 360 | |
| Inuit | 11 885 | 13 945 | |
| Labour market | Jobs, 2018 (thousands) | 55 | 4 262 |
| Share of the Quebec total | 1.3% | 100% | |
| Growth from 2013 to 2018 | 2.8% | 5% | |
| Unemployment rate, 2018 | 4.9% | 5.5% | |
| Participation rate, 2018 | 63.6% | 64.6% | |
| Employment rate, 2018 | 60.4% | 61% | |
| Vacant positions, 2019/Q1 | 2 040 | 114 215 | |
| Share of the Quebec total | 1.8% | 100% | |
| Growth from 2018/Q1 to 2019/Q1 | 22.5% | 23% | |
| Production | GDP, 2017 (billions $) | 4 | 385 |
| Share of the Quebec total | 1.1% | 100% | |
| Growth from 2012 to 2017 | 29.1% | 17.5% | |
| GDP per capita, 2017 | $91 721 | $46 392 | |
| Disposable income per capita, 2017 | $26 053 | $28 785 | |
| Industrial structure | Sector breakdown by jobs, 2018 | ||
| Goods-producing sector | 30.1% | 20.2% | |
| - Manufacturing | 11.2% | 11.5% | |
| Service sector | 70.1% | 79.8% | |
| Number of SMEs, December 2018 | 895 | 260 367 | |
| Share of the Quebec total | 0.3% | 100% | |
| Number of SMEs in manufacturing, December 2018 | 13 | 13 493 | |
| Share of the Quebec total | 0% | 100% | |
| Private investment, 2019 (millions $) | 908 | 20 554 | |
| Share of the Quebec total | 4.4% | 100% | |
| Growth from 2018 to 2019 | 51.8% | 10.6% | |
| Business export rate | 11.1% | 29.4% | |
| Advanced technology utilization rate, 2014 | 57.2% | 62.4% | |
| 2014 ranking among the 17 ARs | 17 | N/A | |
| Business climate | Number of devitalized RCMs according to the 2016 EDI | 3 out of 3 | 71 out of 104 |
| Entrepreneurship rate | 1.2% | 2.4% | |
| Number of universities | 0 | 17 | |
| Number of CEGEPs | 0 | 77 | |
| Number of CCTTs | 0 | 59 | |
| Name and rank (out of 125) of entrepreneurial cities as per CFIB, 2018 | N/A | ||
Made up of 3 RCMs: Jamésie, Kativik and Eeyou Istchee
Sources: Institut de la statistique du Québec, Statistics Canada, Centre de recherche industrielle du Québec (and CED's calculations), Ministère de l'Éducation et de l'Enseignement supérieur, Ministère de l'Économie et de l'Innovation, Wikipedia and the Canadian Federation of Independent Business
Map Description
Map of the Nord-du-Québec administrative region, the regional county municipalities (RCMs) it covers, the territory of Canada Economic Development for Quebec Regions' (CED's) Abitibi-Témiscamingue and Nord-du-Québec Business Office (BO) and the territories served by neighbouring BOs.
Outaouais
| Key Economic Indicators | Outaouais | Quebec as a whole | |
|---|---|---|---|
| Demographics | Population. 2018 | 390 830 | 8 390 499 |
| Share of the total population of Quebec | 4.7% | 100% | |
| Growth from 2013 to 2018 | 3.2% | 3.4% | |
| Proportion of women | 50.3% | 50.1% | |
| By age group. 2018 | |||
| 0-24 | 28.2% | 26.8% | |
| 25-64 | 55.8% | 54.3% | |
| 65 and over | 16.1% | 18.8% | |
| Aboriginal identity population, 2016 | 20 690 | 182 885 | |
| First Nation | 8 335 | 92 655 | |
| Métis | 11 270 | 69 360 | |
| Inuit | 145 | 13 945 | |
| Labour market | Jobs, 2018 (thousands) | 204 | 4 262 |
| Share of the Quebec total | 4.8% | 100% | |
| Growth from 2013 to 2018 | 5.7% | 5% | |
| Unemployment rate, 2018 | 4.9% | 5.5% | |
| Participation rate, 2018 | 65.9% | 64.6% | |
| Employment rate, 2018 | 62.7% | 61% | |
| Vacant positions, 2019/Q1 | 3 245 | 114 215 | |
| Share of the Quebec total | 2.8% | 100% | |
| Growth from 2018/Q1 to 2019/Q1 | -4.6% | 23% | |
| Production | GDP, 2017 (billions $) | 14 | 385 |
| Share of the Quebec total | 3.5% | 100% | |
| Growth from 2012 to 2017 | 18.8% | 17.5% | |
| GDP per capita, 2017 | $35 153 | $46 392 | |
| Disposable income per capita, 2017 | $27 318 | $28 785 | |
| Industrial structure | Sector breakdown by jobs, 2018 | ||
| Goods-producing sector | 13.5% | 20.2% | |
| - Manufacturing | 3.4% | 11.5% | |
| Service sector | 86.5% | 79.8% | |
| Number of SMEs, December 2018 | 8 079 | 260 367 | |
| Share of the Quebec total | 3.1% | 100% | |
| Number of SMEs in manufacturing, December 2018 | 236 | 13 493 | |
| Share of the Quebec total | 2% | 100% | |
| Private investment, 2019 (millions $) | 491 | 20 554 | |
| Share of the Quebec total | 2.4% | 100% | |
| Growth from 2018 to 2019 | 2% | 10.6% | |
| Business export rate | 14.4% | 29.4% | |
| Advanced technology utilization rate, 2014 | 62% | 62.4% | |
| 2014 ranking among the 17 ARs | 9 | N/A | |
| Business climate | Number of devitalized RCMs according to the 2016 EDI | 4 out of 5 | 71 out of 104 |
| Entrepreneurship rate | 2.1% | 2.4% | |
| Number of universities | 1 | 17 | |
| Number of CEGEPs | 3 | 77 | |
| Number of CCTTs | 1 | 59 | |
| Name and rank (out of 125) of entrepreneurial cities as per CFIB, 2018 | Gatineau (28) | N/A | |
Made up of 5 RCMs: Papineau, Gatineau, Les Collines-de-l'Outaouais, La Vallée-de-la-Gatineau and Pontiac
Sources: Institut de la statistique du Québec, Statistics Canada, Centre de recherche industrielle du Québec (and CED's calculations), Ministère de l'Éducation et de l'Enseignement supérieur, Ministère de l'Économie et de l'Innovation, Wikipedia and the Canadian Federation of Independent Business
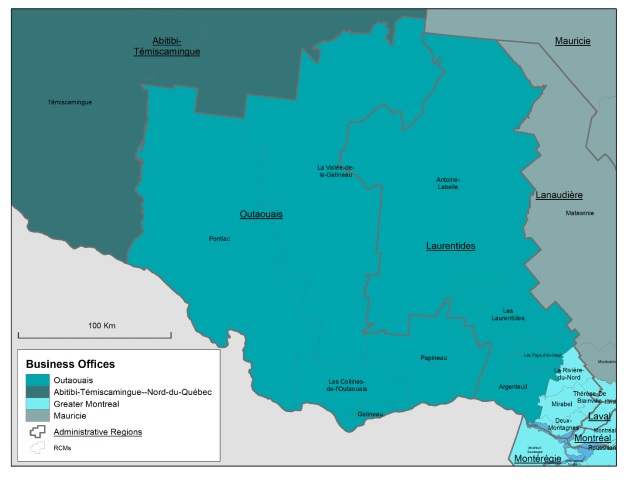
Map Description
Map of the Outaouais administrative region, the regional county municipalities (RCMs) it covers, the territory of Canada Economic Development for Quebec Regions' (CED's) Outaouais Business Office (BO) and the territories served by neighbouring BOs.
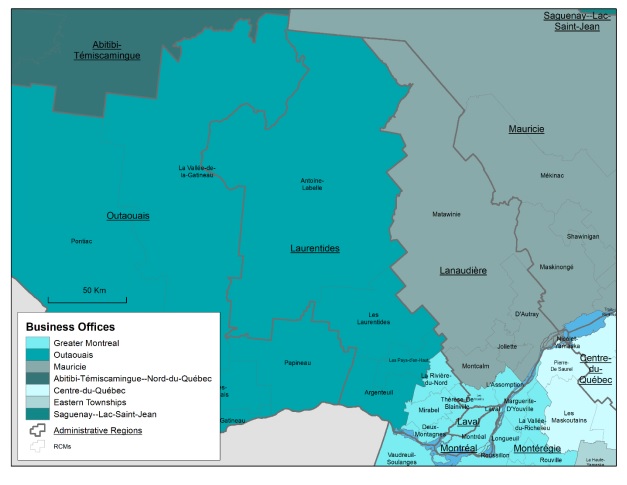
Saguenay–Lac-Saint-Jean
| Key Economic Indicators | Saguenay–Lac-Saint-Jean | Quebec as a whole | |
|---|---|---|---|
| Demographics | Population. 2018 | 277 406 | 8 390 499 |
| Share of the total population of Quebec | 3.3% | 100% | |
| Growth from 2013 to 2018 | -0.2% | 3.4% | |
| Proportion of women | 49.4% | 50.1% | |
| By age group. 2018 | |||
| 0-24 | 24.9% | 26.8% | |
| 25-64 | 53.1% | 54.3% | |
| 65 and over | 22% | 18.8% | |
| Aboriginal identity population, 2016 | 14 655 | 182 885 | |
| First Nation | 5 305 | 92 655 | |
| Métis | 8 770 | 69 360 | |
| Inuit | 85 | 13 945 | |
| Labour market | Jobs, 2018 (thousands) | 124 | 4 262 |
| Share of the Quebec total | 2.9% | 100% | |
| Growth from 2013 to 2018 | -3% | 5.0% | |
| Unemployment rate, 2018 | 6.1% | 5.5% | |
| Participation rate, 2018 | 57.4% | 64.6% | |
| Employment rate, 2018 | 53.9% | 61% | |
| Vacant positions, 2019/Q1 | 2 500 | 114 215 | |
| Share of the Quebec total | 2.2% | 100% | |
| Growth from 2018/Q1 to 2019/Q1 | 10.6% | 23.0% | |
| Production | GDP, 2017 (billions $) | 11 | 385 |
| Share of the Quebec total | 2.8% | 100% | |
| Growth from 2012 to 2017 | 9.5% | 17.5% | |
| GDP per capita, 2017 | $39 543 | $46 392 | |
| Disposable income per capita, 2017 | $27 085 | $28 785 | |
| Industrial structure | Sector breakdown by jobs, 2018 | ||
| Goods-producing sector | 24% | 20.2% | |
| - Manufacturing | 12.5% | 11.5% | |
| Service sector | 76% | 79.8% | |
| Number of SMEs, December 2018 | 8 885 | 260 367 | |
| Share of the Quebec total | 3.4% | 100% | |
| Number of SMEs in manufacturing, December 2018 | 472 | 13 493 | |
| Share of the Quebec total | 3% | 100% | |
| Private investment, 2019 (millions $) | 1 147 | 20 554 | |
| Share of the Quebec total | 5.6% | 100% | |
| Growth from 2018 to 2019 | 30.5% | 10.6% | |
| Business export rate | 15.5% | 29.4% | |
| Advanced technology utilization rate, 2014 | 59.9% | 62.4% | |
| 2014 ranking among the 17 ARs | 12 | N/A | |
| Business climate | Number of devitalized RCMs according to the 2016 EDI | 4 out of 5 | 71 out of 104 |
| Entrepreneurship rate | 2.2% | 2.4% | |
| Number of universities | 1 | 17 | |
| Number of CEGEPs | 5 | 77 | |
| Number of CCTTs | 5 | 59 | |
| Name and rank (out of 125) of entrepreneurial cities as per CFIB, 2018 | Alma (41) and Saguenay (101) | N/A | |
Made up of 5 RCMs: Le Domaine-du-Roy, Maria-Chapdelaine, Lac-Saint-Jean-Est, Saguenay and Le Fjord-du-Saguenay
Sources: Institut de la statistique du Québec, Statistics Canada, Centre de recherche industrielle du Québec (and CED's calculations), Ministère de l'Éducation et de l'Enseignement supérieur, Ministère de l'Économie et de l'Innovation, Wikipedia and the Canadian Federation of Independent Business
.jpg)
Map Description
Map of the Saguenay–Lac-Saint-Jean administrative region, the regional county municipalities (RCMs) it covers, the territory of Canada Economic Development for Quebec Regions' (CED's) Saguenay–Lac-Saint-Jean Business Office (BO) and the territories served by neighbouring BOs.
CED’s mandate and strategic foundations
Canada Economic Development for Quebec Regions (CED)
- Half a century of achievements in regional development
- Established under the Economic Development Agency of Canada for the Regions of Quebec Act
Mission:
“Promote the long-term economic development of the regions of Quebec by giving special attention to those where slow economic growth is prevalent or where opportunities for productive employment are inadequate.
Promote cooperation and complementarity with Quebec and communities in Quebec.”
- Section 10 of the Act
We are present in all regions, at the heart of distinct economic dynamics
Sub-regional differences
- 71 of the 104 regional county municipalities have low economic development potential
- 85% of the inhabited rural territory does not have access to high-speed Internet
Factors of influence: workforce; market access; single-industry economies; demographics; urban and rural regions; resources; Indigenous territories
The importance of SMEs in Quebec*
- There are over 241,000 SMEs in Quebec, 50% of which have fewer than 10 employees
- They account for 87% of private sector jobs and generated 84.4% of new private sector jobs between 2013 and 2017
* Industry Canada, Key Small Business Statistics (2019)
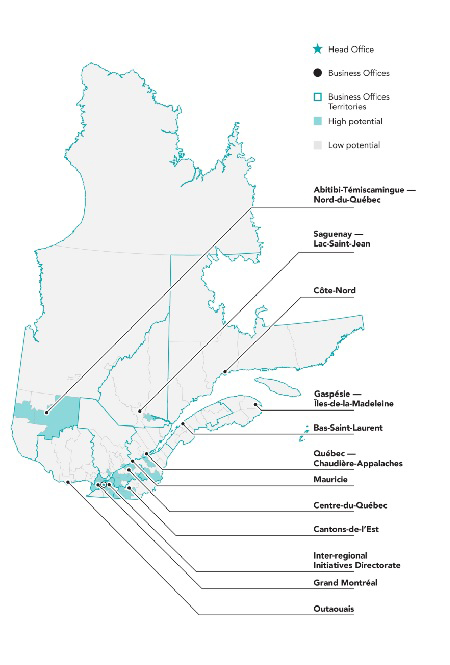
Map description
Map of Quebec with the head office, business offices and the territories they serve, as well as territories with strong and weak potential.
Our priority areas of intervention respond to the economic challenges of Quebec’s regions
| Challenges | Shortage of manpower/business succession | Gaps in commercialization/ market diversification | Lag in productivity and investments | Adaptation to climate change | Devitalized communities experiencing adaptation difficulties |
|---|---|---|---|---|---|
| Priority areas of intervention |
Increasing the competitiveness of Quebec businesses CED supports SMEs in the adoption, adaptation and commercialization of technologies that will improve their productivity, accelerate their growth and enhance their competitiveness in all markets |
||||
|
Fostering clean growth CED encourages the development, adoption and commercialization of clean technologies that will increase the industrial productivity and competitiveness of SMEs |
|||||
|
Encouraging innovative entrepreneurship CED contributes to the renewal and strengthening of Quebec’s pool of innovative companies by supporting incubators and accelerators, industrial clusters, and established SMEs in their innovation efforts |
|||||
|
Promoting community vitality CED promotes growth for all by strengthening the entrepreneurial and industrial fabric of regions and communities through diversification, the enhancement of their assets, the promotion of foreign investment and support for economic participation for all and in all regions of Quebec |
|||||
Our added value – expertise, investments and network
- The face of the federal government in Quebec
- 12 business offices in all regions
- Main source of federal announcements in Quebec
- Economic development approach based on best practices recognized by the OECD
- Regional perspective and delivery of national policies
- 2,449 projects supported* and $791 M invested* over the last 3 years to generate long-term economic benefits
- Complementarity of interventions, collaboration and ongoing dialogue with the Government of Quebec and the other economic development stakeholders in the field
- $322 M ** budget*** and 342 full-time equivalents*** (current year)
- Resources and experts who support the development, delivery and evaluation of programs and initiatives
* Three years of data (2016-2017, 2017-2018 and 2018-2019)
** Including a $44-million operating budget
*** 2019-2020 DP
Our approach – operating locally with agility
National Priorities
- Fuels reflections on priorities
- Implemented according to real needs in the field
Place-based approach
Flexibility in implementation
- Differentiated program modalities depending on areas of intervention
Coordinated response when possible
- Complementarity and synergy of interventions; intersectoral cooperation and cooperation between different levels of government
Credible antennas in the field
- Regional presence
- Field intelligence: how challenges are experienced and addressed in light of regional realities
Lens (analysis grid) adapted to context
- Economic Development Index (EDI) for modulated interventions according to local realities and for significant results that meet actual needs
Adapted design of programs and interventions
- To a diversified clientele (SMEs, NPOs, communities, clusters, universities, etc.)
- To different types of projects that build on comparative regional advantages
- Through flexible financial tools
Our programs and initiatives are flexible and adapted
- Regional Economic Growth through Innovation (REGI)
- Quebec Economic Development Program (QEDP)
- Community Futures Program (CFP)
- Official Languages Economic Development Initiative
- Delivering national initiatives
- Quebec-specific initiatives
CED has an umbrella decree (M-30) to facilitate the implementation of its programs in Quebec
Regional Economic Growth through Innovation (REGI)
- Program aimed at supporting the growth of businesses and regions through innovation
- Delivered by CED in Quebec, taking into account the needs of our businesses and regions
Component - Business Scale-up and Productivity
Supports business growth, productivity and competitiveness through innovation:
- Adoption, adaptation and demonstration of advanced technologies
- Commercialization and market expansion
Component - Regional Innovation Ecosystems
Supports the development of an inclusive regional entrepreneurial environment:
- That meets business needs
- That is conducive to innovation and business growth
Examples of eligible clients
- SMEs
- NPOs
- Economic development or business support organizations
- Organizations dedicated to attracting foreign investment
- Business incubators and accelerators
- Knowledge and technology transfer institutions
- Municipalities and regional county municipalities (RCMs)
Quebec Economic Development Program (QEDP)
- Supports regional economic development and diversification
Strengthening regional economic activity and generating investments and economic spinoffs by acquiring community economic equipment
Asset projects must:
- Benefit many users, primarily businesses and tourists
- Be a regional priority
- Be part of a comprehensive, shared regional development or diversification approach
Promoting regional assets to attract international organizations and increase spending by tourists from outside Quebec
- Help regions position themselves competitively
- Help regions maximize their national and international appeal
Examples of eligible clients
- NPOs
- Economic development organizations
- Tourism organizations
- Municipalities and regional county municipalities (RCMs)
- Organizations dedicated to attracting international organizations
- Local businesses
Community Futures Program (CFP)
- Fosters stability, economic growth and job creation
- Generates diversified, competitive local economies in rural areas
- Supports sustainable communities
Program delivered through:
- 57 Community Futures Development Corporations located in designated rural areas
- 8 Business Development Centres located in peri-urban areas
Economic Development Initiative – Linguistic Duality
Fosters the economic development of official language minority communities (OLMCs)
Through activities related to:
- Innovation
- Entrepreneurship
- Partnership creation
- Economic diversification
Examples of eligible clients
- Small and medium-sized businesses in an RCM with an English-speaking population greater than 5% outside the Greater Montreal area
- NPOs in an RCM with an English-speaking population greater than 500
Targeted ad hoc support
- Delivering national initiatives in Quebec
Steel and Aluminum Initiative*
Support innovative projects of SMEs operating in the Canadian steel and aluminum supply chain.
Women Entrepreneurship Strategy (WES)*
Facilitate women entrepreneurs’ access to the talents, skills, networking opportunities and funding they need to grow their businesses
Canadian Experiences Fund (CEF)
Offer new tourism products or experiences, improve what is already offered, and create, renovate or expand tourism facilities
* Call for proposals now closed.
Targeted ad hoc support
- Quebec-specific initiatives (with additional funding)
Canadian Initiative for the Economic Diversification of Communities Reliant on Chrysotile
Support communities and businesses in the Les Sources and Appalaches RMCs in their efforts to transition to new economic activities
Economic Recovery Initiative for the Town of Lac-Mégantic
Help rebuild the city, support SMEs and NPOs, and make two investment funds available to the community following the 2013 rail accident
Targeted ad hoc support
- Quebec-specific initiatives (without additional funding)
Incubators and Accelerators Driven by Excellence (IADE) initiative*
Help incubators and accelerators in Quebec regions to position themselves at a world-class level of excellence
CED Fast Forward Challenge**
Support innovative entrepreneurship and young talent, particularly among engineering students, in order to foster Quebec's entrepreneurial renewal
* Call for proposals now closed;
** Competition - Application period now closed
Our interventions have a concrete impact on the ground
Satisfied clients
- 93% are satisfied with CED programs and their delivery*
Leverage effect
- $1 invested by CED → $4.2 in investments from other sources**
* 2016-2017 Annual Satisfaction Survey;
** Leverage effect over 3 years (2016-2017, 2017-2018 and 2018-2019)
Interventions that make a difference
… for SMEs
- Growing businesses: 73% of businesses supported by CED increased their sales*
- 268 new innovation projects: over 4000 jobs potentially created/maintained*
- Sustainable businesses: Business survival rate for CFP-assisted firms was 34% higher than that of non-clients*
… for regions
- $248M in investments generated in communities for ad hoc or targeted support*
- $35.8M invested to support 127 tourism projects**
Sources:
* 2017-2018 DRR;
** 2017-2018 Hermes data
Our governance
Manon Brassard
Deputy Minister / President of CED
Manon Brassard took office on June 27, 2016.
From 2010 to 2016, she held Assistant Deputy Minister positions at Citizenship and Immigration Canada (Corporate Services), Agriculture and Agri-Food Canada (Programs) and the Treasury Board Secretariat (Compensation and Labour Relations).
She is back at CED, where she previously served as Vice-President of Operations from 2003 to 2010 and acquired a thorough knowledge of economic development in Quebec.
She has a Bachelor of Law from Laval University and is a member of the Barreau du Québec. She is also an accredited mediator.
- Minister
- Manon Brassard
Deputy Minister / President- Mark Quinlan
Vice-President
Operations - Jean-Frédéric Lafaille
Vice-President
Policy and Communications - Guy Lepage
Vice-President
Corporate Services
- Mark Quinlan
- Manon Brassard
CED: Federal partner for regional economic development in Quebec
Our mission
Promote the long-term economic development of all regions of Quebec
- With special attention to regions with slow economic growth
- Complementing the activities of the Quebec government and communities
- By bringing strategic partners together
Our presence
- 12 business offices, in all regions
- An understanding of the different regional economic dynamics
- Interventions tailored to local development potential
Our priority areas of intervention
| Challenges | Shortage of manpower/business succession | Gaps in commercialization/ market diversification | Lag in productivity and investments | Adaptation to climate change | Devitalized communities experiencing adaptation difficulties |
|---|---|---|---|---|---|
| Priority areas of intervention | Increasing the competitiveness of Quebec businesses | ||||
| Fostering clean growth | |||||
| Encouraging innovative entrepreneurship | |||||
| Promoting community vitality | |||||
Our approach
Intervene locally with agility:
- Field intelligence – a close assessment of context to design interventions adapted to needs
- Flexibility in program design and implementation
- Cooperation with various regional players
Our added value
- 342 full-time equivalents (FTEs) dedicated to program and initiative development, delivery and assessment
- 2449 projects supported over the last three years, for a total investment of $791M
Satisfied clients
- 93% of clients satisfied with CED‘s programs and service delivery*
Leverage effect
- $1 → $4.2 – Each dollar invested by CED generates investments of $4.2 from other sources**
Sources:
* 2016-2017 Annual Satisfaction Survey
** Leverage effect over last three years
National Priorities
- Fuels reflections on priorities
- Implemented based on real needs in the field
Place-based approach
- Credible antennas in the field
- Flexibility in implementation
- Coordinated response when possible
- Lens (analysis grid) adapted to the context
- Adapted Design of programs and interventions
History and context of regional development agencies
Regional Development Agencies (RDAs) are the federal organizations dedicated to the economic development of the regions they serve. The regional development agency model was started more than 50 years ago.
This flexible model evolved from a single organization in the 1960s to four agencies in the 1980s to six since 2009, thus serving all of Canada thanks to a strong federal presence in the regions (see map):
- Federal Economic Development Initiative for Northern Ontario (FedNor): created in 1987 as a branch under Industry Canada;
- Atlantic Canada Opportunities Agency (ACOA): created through an Act of incorporation in effect since 1988;
- Western Economic Diversification Canada (WD): created through an Act of incorporation in effect since 1988;
- Economic Development Agency of Canada for the Regions of Quebec (CED): created in 1988, through an Act of incorporation in effect since 2005;
- Federal Economic Development Agency for Southern Ontario (FedDev Ontario): created by Order in Council following Budget 2009;
- Canadian Northern Economic Development Agency (CanNor): established under the existing legislation of the Department of Indigenous and Northern Affairs Canada in 2009.
Since November 20, 2019, the RDAs are under the responsibility of the Minister of Economic Development and Official Languages, and work closely with member organizations of the Innovation, Science and Industry portfolio.
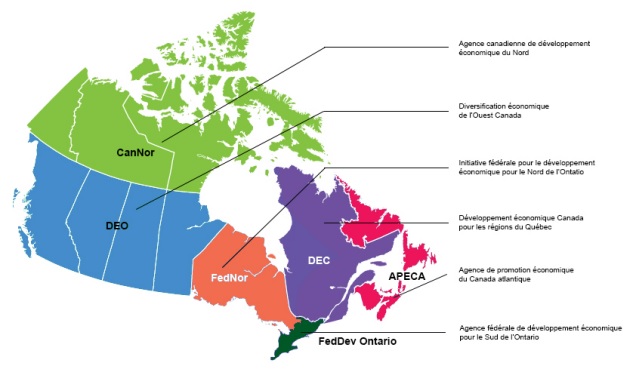
Map description:
Map of Canada with the regions served by the different federal regional development agencies (RDAs).
Roles
RDAs rely on their strong presence in the field to develop and implement programs and initiatives that deliver on government priorities based on socio-economic realities and business needs in the regions. RDAs pursue similar objectives and results, while adapting their actions to the needs and realities of their respective regions.
In particular, they:
- implement government priorities in the regions;
- work closely with strategic partners at the regional level;
- ensure that regional perspectives are taken into account in national policy making.
Specifics
Understanding specific issues in all regions of Canada
- Located in the regions (outside the National Capital), RDAs can grasp the economic dynamics of their respective regions, understand the challenges and opportunities facing SMEs and communities, and target their competitive advantages, potential and assets.
Proven place-based intervention approach
- An informed commitment to local and regional players to ensure coherent policies and programs adapted to regional realities that have a real impact in the field;
- The opportunity to put forward the regions’ perspectives on national issues of common interest—to try to bring the regional lens to the design, and not just implementation, of initiatives.
Flexible tools tailored to different needs
- With great agility to intervene and programs with flexible terms, RDAs can implement a wide range of initiatives, and adapt quickly to changing priorities and evolving regional and local needs—sometimes suddenly, such as during natural disasters and economic crises;
- Strategic research, analysis and program development capabilities enable evidence-based decision-making.
Well-established relationships with various partners in the regions
- Strong alliances with federal partners, the private sector, industry organizations, community organizations, and provinces and territories enable an aligning of our interventions to complement those of other players present;
- Heads of the federal regional councils since 2014;
- Canada’s representation on the OECD Territorial Development Policy Committee on a rotating basis – FedDev Ontario is currently chairing this committee.
Programs and initiatives
RDAs are responsible for delivering programs and initiatives in their respective regions according to regional realities and community needs. Some programs are shared, such as the Regional Economic Growth through Innovation (REGI) program and Community Futures Program (CFP), while others are specific to each RDA, such as CED’s Quebec Economic Development Program (QEDP).
In 2018, through REGI, RDAs became one of four national platforms to support innovation along with the Industrial Research Assistance Program (IRAP) (National Research Council Canada), the Strategic Innovation Fund (SIF) (Innovation, Science and Economic Development) and the Canadian Trade Commissioner Service (TCS) (Global Affairs Canada).
RDAs take the lead in implementing Regional Growth Strategies, which leverage federal partnerships to grow the economy and create quality jobs. The scope of these strategies varies greatly from region to region.
2. Operational Considerations
- Overview of grant and contribution programs
- Program delivery
- Program details
- Regional innovation
- Community vitality
- Targeted ad hoc support
- Women Entrepreneurship Strategy
- Steel and Aluminum Initiative
- Canadian Experiences Fund
- Canadian Initiative for the Economic Diversification of Communities Reliant on Chrysotile
- Economic Recovery Initiative for Lac-Mégantic
- Initiative for the Development of Economic Infrastructure in Quebec
- CED’s Fast Forward Challenge
- Incubators and Accelerators Driven by Excellence
- Programs and initiatives in effect
- Industrial and Technological Benefits (ITB)
Overview of grant and contribution programs
CED program inventory
Our funding programs are grouped together under three categories that take into account the intended outcomes.
- Regional Economic Growth through Innovation (REGI)
- Quebec Economic Development Program (QEDP)
- Community Futures Program (CFP)
- Official Languages Economic Development Initiative (EDI)
- National initiatives
- Quebec-specific initiatives
- With a supplementary budget
- Without a supplementary budget
Regional innovation
- Regional Economic Growth through Innovation (REGI): Supports business productivity and growth through innovation and the development of regional innovation ecosystems that can assist businesses.
Community vitality
- Quebec Economic Development Program (QEDP): Supports regional economic development and diversification.
- Community Futures Program (CFP): Supports local economic diversification in rural communities.
- Official Languages Economic Development Initiative (EDI): Fosters the economic development of official language minority communities.
Targeted ad hoc support
NATIONAL INITIATIVES – CED oversees certain temporary national programs implemented in Quebec:
QUEBEC-SPECIFIC INITIATIVES – CED is equipped and is present on the ground to support local needs quickly, particularly during crises, as well as to develop initiatives that respond to needs specific to Quebec to achieve government priorities.
Designed and implemented by CED, with a supplementary budget:
Designed and implemented by CED, without a supplementary budget:
- Women Entrepreneurship Strategy (WES)
- Steel and Aluminum Initiative (SAI)
- Canadian Experiences Fund (CEF)
- Canadian Initiative for the Economic Diversification of Communities Reliant on Chrysotile
- Economic Recovery Initiative for the Town of Lac-Mégantic
- Initiative for the development of regional economic infrastructure in Quebec: To support structural projects in the transportation, tourism and research sectors that contribute to regional vitality and attractiveness.
- Fast Forward Challenge: To support innovative entrepreneurship and young talent, particularly engineering students, to promote business succession in Quebec.
- Incubators and Accelerators Driven by Excellence (IADE) Initiative: To help incubators and accelerators in Quebec regions achieve a world-class level of excellence.
More details about these grant and contribution programs and initiatives can be found in the individual fact sheets.
Main types of funding
CED uses two types of funding: grants and contributions.
These two types of funding are awarded in accordance with various government policies and directives, notably the Policy on Transfer Payments. CED’s choice of funding is based on a number of criteria associated with the types of recipients (e.g., businesses or non-profit organizations) and with the projects they submit. The type of funding is governed by a written agreement with the client.
1. Contributions
Contributions come with various conditions (objectives, costs, activities, results), and clients must submit regular reports on progress and results. Contributions are subject to audits conducted by CED.
There are two types of contributions:
- Repayable contributions:
- For commercial projects, in particular for businesses.
- Clients must repay the contribution according to predetermined criteria and a repayment schedule set out in the funding agreement.
- Non-repayable contributions:
- For projects involving collective outcomes that benefit a number of organizations or businesses, or the region as a whole.
- There is general agreement that the client does not generate enough revenue to be able to repay the contribution.
2. Grants
Grants differ from contributions in that the amount paid is not subject to specific conditions governing project delivery, the submission of invoices, or reporting. A grant is an appropriate funding tool for small-scale projects that have a low level of complexity and involve little or no risk (a study, a plan, etc.). CED uses grants sparingly.
Program delivery
CED promotes policies and programs that support government priorities and take into account the economic context in Quebec, Canada and around the world.
Businesses and non-profit organizations (NPOs) wishing to receive a financial contribution from the federal government can contact CED via the agency’s website or through one of CED’s 12 regional business offices. The twelfth business office operates out of CED’s Head Office and oversees special initiatives and projects being carried out in the territories of more than one business office.
All CED advisors are very familiar with the entrepreneurs and NPOs in their region. They are able to discuss projects with SMEs or NPOs, as they are being developed, and are in constant contact with their partners in the federal and provincial governments and in local and regional economic development organizations, with whom they work cooperatively whenever possible.
Advisors will make sure that the projects they discuss with potential clients contribute to the achievement of government priorities and are in line with CED’s priorities and the office’s regional strategy. In the case of projects that do not meet these criteria, proponents will not be encouraged to submit an application; instead, advisors will help them identify other sources of federal or provincial government assistance.
CED sometimes issues calls for projects. This is generally the case when the government plans to introduce a special initiative with a specific budget and a predetermined deadline for project completion. Demand generally exceeds available funds, meaning that some good projects may be rejected. However, when proponents whose projects have not been selected contact CED for feedback, CED advisors try to direct them towards partners that are most likely to be able to provide assistance.
Program delivery process
The diagram below illustrates the delivery process for CED programs. Each project is subject to rigorous review and monitoring, guided by Treasury Board policies and directives and best business practices. The process is designed to achieve the results the government wants, to serve Canadians well, and to manage public funds well. It includes service standards that are customer-oriented and comply with the ISO standard. Its different steps are detailed below.
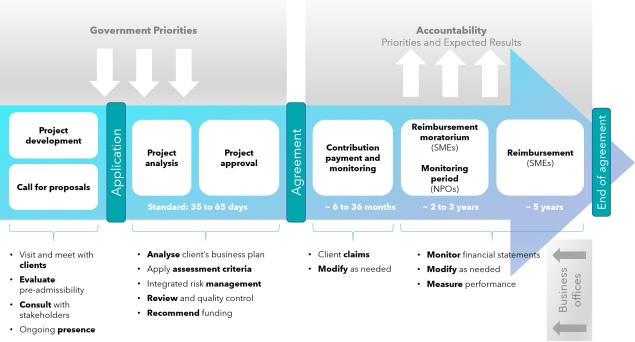
Text version:
Diagram outlining CED's program delivery process. The first part of the process is directly influenced by government priorities. This includes the steps of project development and calls for proposals during which client visits and meetings occur, pre-eligibility assessments and stakeholder consultations by business offices, which are continuously present. Once the application has been submitted, we proceed with the project analysis and approval step. Service standards for these steps extend from 35 to 65 days. These steps include an analysis of the client’s business plan, the application of evaluation criteria, integrated risk management, quality review and control and a recommendation for funding by the business office. The second part of the process involves accountability. Contribution payment and monitoring occur from 6 to 36 months following the agreement. During this period, the business office receives the client’s claims and makes the necessary modifications. The repayment moratorium for SMEs and the monitoring period for NPOs occur during the following 2 to 3 years. SMEs have approximately 5 years to complete their repayment and come to the end of the agreement. Monitoring of financial statements, modifications and performance measurement will then be done by the business office.
* In the case of a call for proposals, there is no project development stage. The client submits an application using a form that can be adapted to the requirements of the initiative. In order to select the projects that best meet the objectives of the initiative, temporary teams of analysts are set up to assess the eligibility of the projects and prioritize them based on pre-established criteria.
Analysing and approving projects
Projects must contribute to the achievement of the government priorities assigned to CED. They are subsequently analysed to assess the completion risk level and, if applicable, the proponent’s repayment capacity.
Factors such as the degree of experience of the client’s management team, the viability of the funding arrangement, and compliance with international trade agreements are taken into account.
Each analysis includes a compliance and consistency verification. Once a project is ready and at your convenience, it may be submitted to you for guidance. In all cases, the project is subsequently submitted to the Deputy Minister / President for approval.
Issuing and managing contribution agreements (contracts)
Once a project has been approved, the client must sign a contribution agreement letter; this is a contract between the client and the Government of Canada. The project can now be announced publicly. In all cases, projects must be proactively disclosed.
The agreement, which may cover a period of 8 to 10 years, is generally based on the following model:
Contribution payment – Contributions are paid out based on the project implementation timeline and upon submission of claims for costs incurred and, when required, supporting documentation.
Payments are typically spread out over a period of 6 to 36 months.
Grant payment – Grants are generally awarded in the form of a lump-sum payment, without any supporting documentation required, upon signature of the agreement. CED requires that the client submit a project completion report after the end date of the project.
Historically, CED rarely awards grants, preferring non-repayable contributions instead.
Moratorium and repayment – At the end of the project and after the contribution has been paid out, clients who received repayable assistance benefit from a repayment moratorium period, usually two years.
Clients must then make regular interest-free contribution repayment installments that can be spread out over a period of up to five years.
Clients receiving non-repayable assistance are subject to a two-year monitoring period after the end of the project; the agreement remains in effect during this period.
Monitoring – Clients are regularly audited throughout the course of an agreement based on the level of risk of the project. Amendments to the agreement may be required to respond to changes in circumstances or to address certain issues.
CED may put a client in default and take back its contribution in order to protect public funds, e.g., if a client declares bankruptcy or abandons its project.
Service standards
CED is committed to providing its clients with professional, responsive, courteous, confidential and timely service:
- Between 35 and 65 calendar days for funding decisions, following submission of a complete application; and
- Up to 25 calendar days for claim processing.
For the 2018–2019 fiscal year, CED obtained the following results:
- An average of 49 calendar days for a decision regarding a funding application
- An average of 15 calendar days for processing a claim under its regular programs
- 9 calendar days to process a claim under the Community Futures Program (CFP)
Program details
Regional innovation
Regional economic growth through innovation
The Regional Economic Growth through Innovation (REGI) program, which has been in place since 2018, is a grant and contribution program that supports innovation as a key means of fostering business growth. REGI is shared by all the regional development agencies (RDAs); however, each RDA administers the program and funds projects based on its own specific situation and budget.
Objectives
The objectives of REGI are as follows:
- Business productivity and growth – through targeted investments in the demonstration, adoption and adaptation of technologies, as well as in growth, commercialization and market development and expansion.
- The development of regional innovation ecosystems – through funding for economic players in the regions, generally NPOs, that help businesses develop, supporting them during all stages of the innovation process.
Who can submit projects?
The main eligible recipients are:
- Small and medium-sized businesses (SMEs)
- Non-profit organizations (NPOs), primarily those whose core mission is business support (e.g., incubators and accelerators, technology transfer centres and export promotion organizations)
- Organizations and institutions dedicated to knowledge promotion and dissemination (including universities and educational institutions)
- Co-operatives
- Provincial organizations, municipalities and municipal organizations
- Indigenous organizations
Projects can be submitted to CED as soon as they are ready (on an ongoing basis).
Funding
Two types of funding are provided under this program:
- Contributions: These account for the lion’s share of the funding awarded under REGI. A decision by Cabinet and the Treasury Board is required for all contributions over $20M.
- Grants: These can be awarded in the case of low-risk projects (do not include business projects, since grants are not repayable). Maximum of $200K per project.
REGI has two components:
1. Business Scale-up and Productivity (BSP)
Funding under this component is generally awarded to SMEs that submit innovative projects aimed at growing their business, enhancing their productivity and/or marketing their products.
What projects are eligible? – CED prioritizes funding for projects by
- Businesses seeking, among other things, to
- develop new value-added goods and services;
- adopt state-of-the-art equipment or technologies; or
- develop or diversify into international markets.
- Organizations that, among other things,
- provide services, coaching or access to equipment to help businesses innovate, develop, grow and be competitive.
2. Regional Innovation Ecosystems (REI)
An ecosystem is made up of many different players who, through the services they provide and their various roles and expertise, work together to foster growth of businesses in a given region or sector. Funding provided under this component is generally awarded to NPOs that contribute to the creation of an entrepreneurial environment conducive to innovation in order to meet business needs.
What projects are eligible? – CED prioritizes funding for projects that
- bring ecosystem players together and foster their development; and
- support the creation, growth and sustainability of regional clusters.
Community vitality
Quebec Economic Development Program
The Quebec Economic Development Program (QEDP), which has been in place since 2012, is one of the regular grant and contribution programs that support regional community development and economic diversification.
Objectives
The objectives of the QEDP are as follows:
- Contribute to local development by providing support for local or regional businesses, as well as for community economic facilities that bolster a region’s vibrancy and attractiveness.
- Support the development and promotion of regional assets, specifically by assisting tourism sector businesses and organizations, and international organizations (IOs).
Who can submit projects?
The main eligible recipients are:
- Small and medium-sized enterprises (SMEs)
- Non-profit organizations (NPOs)
- Co-ops
- Provincial organizations, municipalities and municipal organizations
- Indigenous organizations
Projects can be submitted to CED as they are ready (on an ongoing basis).
Funding
Two types of funding are provided under this program:
- Contributions: These account for the lion’s share of funding awarded under the QEDP. Contributions are repayable in the case of commercial projects, and proponents are held accountable to CED regarding the use of the funds. CED cannot award contributions of $10M or higher without prior Treasury Board approval. A Cabinet decision is required for all projects for which the maximum amount exceeds $20M.
- Grants – CED uses this type of funding sparingly. Grants are not repayable, and there are no associated accountability requirements. They are only used for low-risk projects, and there is a maximum of $50K per project.
QEDP has two components:
1. Local development
Funding provided under this component primarily targets the development of local entrepreneurship and the planning and funding of community economic facilities (CEF) that are likely to contribute to the economic growth or vitality of the regions.
What projects are eligible? CED prioritizes funding for projects targeting:
- local entrepreneurship;
- strategic planning;
- the engagement and focus of economic development stakeholders on issues specific to their communities; and
- the creation of development, diversification or recovery plans or strategies.
Example of a project:
CED provides funding for a cheese producer’s expansion project involving the acquisition of various pieces of equipment to enable the business to increase its production in the regional market in order to meet growing demand.
2. Development and promotion of assets and the regions
Funding supports efforts to promote assets and the regions, primarily in the tourism industry, with a view to boosting their attractiveness and competitive positioning. CED’s objective is to increase economic benefits, notably spending by tourists from outside Quebec (in the regions) and from outside Canada (in Montreal). In Montreal, CED’s targeted benefits also include operational spending by international organizations.
What projects are eligible? CED prioritizes funding for projects by:
- tourism businesses and organizations; and
- international organizations attracted to Quebec.
Examples of projects:
CED provides support for the implementation of a plan to market, outside Quebec, tourism products from five tourism regions. The project focuses on showcasing products with significant and distinctive drawing power through alliances with product sponsors, advertising, the distribution of promotional material, participation in events and media relations.
CED provides funding for the operations of an international organization based in Montreal that is associated with the United Nations (UN). This support will help increase Montreal’s influence and visibility around the world and bring in new capital.
Community Futures Program
The Community Futures Program (CFP) is a national program administered and implemented by the regional development agencies (RDAs). The implementation of the program takes into account the realities and needs of rural communities in the various regions. This program supports specific non-profit organizations that help rural communities showcase their capabilities and take charge of their own local economic development.
Objectives
The program has three objectives:
- Foster stability, economic growth and job creation
- Establish diversified and competitive local economies, primarily in rural areas
- Build economically sustainable communities.
The organizations below receive funding under the CFP
In Quebec, CED awards funding solely to the following organizations:
- 57 Community Futures Development Corporations (CFDCs)
- 8 Business Development Centres (BDCs)
- CFDC and BDC Network
- Capital Réseau SADC et CAE
Funding
The five-year (2019–2024) agreements between CED and the various organizations represent a financial commitment of $33.4M / year.
Funding, which is provided in the form of non-repayable contributions, targets all of the organization’s operating costs. Funding for organizations is partially adjusted based on the economic situation and structure of the area covered.
Financial assistance allows these organizations (CFDCs and BDCs) to provide the following services in their rural areas:
- Technical assistance for small businesses and proponents for the delivery of their projects, including the preparation of their business plans;
- Funding for small businesses and young proponents for startup, modernization and expansion projects; the amount of the loans does not generally exceed $150,000; and
- Local economic development involving the implementation of local initiatives aimed at kick starting the economic development of rural communities; this includes planning economic diversification strategies or conducting feasibility studies for the development of new industrial or commercial sectors.
Economic Development Initiative – Official Languages
The Economic Development Initiative (EDI) – Official Languages (the Initiative) supports the Government of Canada’s language strategy. This strategy is outlined in the Action Plan for Official Languages – 2018–2023: Investing in Our Future, which aims to ensure the vitality of both English and French in Canada by focusing on three pillars: Strengthening our communities; Strengthening access to services; and Promoting a bilingual Canada.
In Quebec, the Initiative is implemented by CED according to the terms and conditions of the Quebec Economic Development Program (QEDP) and has an annual budget of $1.8M.
Objectives
The goal of the Initiative is to foster the economic development of official language minority communities (OLMCs) by various means, such as innovation, entrepreneurship, partnerships and economic diversification. In Quebec, the Initiative targets English-speaking communities.
Who can submit projects?
- SMEs whose projects contribute to the vitality of OLMCs and the promotion of bilingualism in regional county municipalities (RCMs) outside the Greater Montreal region where more than 5% of the population is English-speaking.
- Non-profit organizations (NPOs) that operate in areas of Greater Montreal and in RCMs where there are more than 500 English-speaking people.
Projects can be submitted to CED as soon as they are ready (on an ongoing basis).
Funding
- SMEs: Repayable contributions
- NPOs (non-commercial projects): Non-repayable contributions
Specific conditions
Some of the regular intervention parameters are more flexible in the case of the EDI. The following activities are authorized:
- Tourist accommodations: Accommodation projects corresponding to 1-star or higher in isolated OLMCs, as long as they are not in competition with existing establishments
- Tourism product development: Renovation of heritage buildings or buildings used as interpretation centres or museums
- Development of strategies and engagement plans: Projects in OLMCs, even if the initiative is not in response to a recent disaster or economic shock.
Example of projects:
CED funds the operations of an NPO that provides entrepreneurship support for young Anglophones aged 16 to 35 looking to start up a business.
CED provides funding for the purchase of equipment by a start-up co-op located in a devitalized RCM where 85% of the population is English-speaking. The co-op, which operates in the food processing sector, makes northern berry products.
Targeted ad hoc support
Women Entrepreneurship Strategy
Launched in October 2018 and in effect until the end of 2023, the Women Entrepreneurship Strategy (WES) is a national initiative aimed at helping women entrepreneurs overcome barriers to the growth of their business. WES is administered by the regional development agencies.
In Quebec, WES is implemented by CED in accordance with the terms and conditions of the Regional Economic Growth through Innovation (REGI) program.
WES was the subject of three calls for proposals, which have now ended. Recipients have been selected, and CED is managing the agreements signed with them.
Objectives
WES aims to double the number of women-owned businesses by 2025 and achieve the following objectives:
- Directly support women-led businesses to help them grow and explore new markets; and
- Assist organizations that can facilitate skills acquisition in order to increase the presence of women entrepreneurs in sectors in which they are under-represented, or enhance the effectiveness of programs that provide services for women entrepreneurs.
Funding
Non-repayable contributions.
The Strategy had two components:
1. Ecosystem Fund – Regional Stream
The goal of this fund was to promote the growth of women-owned and -led businesses by improving their access to programs and services provided by non-profit organizations (NPOs).
The entire budget—$15.9M over five years (2018–2023)—has been committed.
Who could submit projects?
NPOs that provide services aimed at supporting the development and growth of businesses owned or led by a woman. The establishment of partnerships among organizations at the regional level was encouraged.
What projects were eligible?
- Initiatives that support women entrepreneurs in sectors in which they are traditionally underrepresented;
- Networking, twinning or mentorship opportunities; and
- Strategies for expanding assistance programs for women entrepreneurs in all regions and at the national level
Example of a project:
CED provided funding for an organization that assists and informs women owned businesses in Quebec to help them take advantage of opportunities provided through large companies’ supplier diversity programs. The objective is to build their capacity to identify market opportunities and access potential clients.
A national component was also implemented to support organizations offering services to women entrepreneurs. It was coordinated by Innovation, Science and Economic Development (ISED).
2. Women Entrepreneurship Fund
This fund provided direct non-repayable funding (up to $100,000) to women-owned and -led businesses for projects with a maximum duration of 12 months, to help them grow their businesses and pursue market opportunities abroad.
This stream had a budget of $5.4M over two years. The budget envelope has been fully committed.
Who could submit projects?
- Businesses owned or led by women
- Small and medium-sized enterprises (SMEs) (less than 500 employees)
- Businesses that have been in existence for at least two years.
What projects were eligible?
- Support for the pursuit of business opportunities abroad (e.g., a marketing strategy, integration into a supply chain, promotion)
- Support for scale-up, expansion and growth (e.g., product and service development and upgrading; inventory management).
Example of a project:
CED is funding a project by a woman-owned high-tech company aimed at developing new markets in the U.S. and Europe through the implementation of a structured marketing strategy that includes the creation and updating of promotional tools and participation in trade shows.
Steel and Aluminum Initiative
En Effective from March 11, 2019, to March 31, 2020, the Steel and Aluminum Initiative (SAI) is a national initiative aimed at supporting SMEs operating within Canadian supply chains that were affected by global market dynamics.
The initiative is being delivered by the regional development agencies (RDAs). In Quebec, it had a budget of $26.2M and was implemented by CED in accordance with the terms and conditions of the Regional Economic Growth through Innovation (REGI) program.
The SAI was carried out via a call for proposals, which has now ended. Recipients have been selected, and CED is managing the agreements with them.
Objectives
The objectives of the SAI were as follows:
- Support innovative projects by SMEs operating within the Canadian steel and aluminum supply chain to help them expand and grow;
- Maintain and create jobs and foster economic growth through the adoption of technologies and innovative processes.
Available funding
The funding was provided in the form of non-repayable contributions ranging from $150K to $1M. The awarding of this type of funding to businesses was exceptional.
Implementation
Who could submit projects?
To be eligible, businesses had to:
- employ 10 to 499 people full-time in Canada;
- have been in existence for at least three years; and
- have steel and aluminum account for at least 20% of the cost of goods sold
What projects were eligible?
CED gave priority to projects that fostered the growth and expansion of SMEs through the adoption of technologies or that aimed to enhance business productivity and competitiveness.
All projects have to be completed by March 31, 2020. No expenses incurred after that date will be accepted.
Example of a project:
CED provided funding for a business that is a sub-contractor integrated into a number of prime contractors’ value chains. The funding enabled the business to acquire new digital production equipment, fit up the production area in its plant and implement a computerized production resource planning system.
Canadian Experiences Fund (CEF)
The Canadian Experiences Fund (CEF) is a two-year (2019–2021) national initiative aimed at supporting the tourism industry. It is part of the Creating Middle Class Jobs: A Federal Tourism Growth Strategy. The CEF is administered by the regional development agencies (RDAs).
In Quebec, the CEF has a budget of $11.5M. It is implemented by CED in accordance with the terms and conditions of the Quebec Economic Development Program (QEDP).
A call for proposals was launched in May 2019. The project application period has ended. Recipients have been selected, and CED is now managing the ensuing agreements that have been signed with them.
Objectives
The goal of the CEF was to support the development of products and experiences that showcase Canada’s assets, as well as the development of tourism activities that take place outside large cities and in seasons other than summer. The priorities were to:
- increase winter and shoulder-season tourism;
- ensure tourism growth in rural and remote communities;
- boost Indigenous tourism;
- promouvoir promote inclusiveness, especially as concerns the LGBTQ2 community; and
- foster culinary tourism and farm-to-table experiences.
Who could submit projects?
The main eligible beneficiaries were:
- non-profit organizations (NPOs);
- commercial enterprises;
- industry associations; and;
- local or Indigenous tourism sector authorities.
Funding
The funding was generally provided in the form of non-repayable contributions. The funding parameters were different from those normally used.
- In the case of SMEs, the financial assistance could not exceed $100K.
- For NPOs, the requested funding could not normally exceed $500K; however, on an exceptional basis, up to 100% of the project costs could be covered through financial assistance, without any financial contribution by the client.
- In the case of local LGBTQ2 “Pride” events (e.g., annual parade), grants of up to $25K could be awarded if warranted by the client’s financial situation and limited resources.
What projects were eligible?
To be eligible, the projects had to foster growth and diversification in the tourism sector. For example:
- Development or upgrading of real property for tourists, such as trails and shelters
- Design of new tourism-related products or services, or the upgrading of existing ones, including tours, special events and festivals
- Co-operation among tourism associations for the purpose of providing training for businesses on product marketing, managing cultural differences, etc.
Example of a project:
CED provided funding for a project submitted by a regional song festival involving the upgrading of reception and accommodation infrastructure. The goal of the project was to increase spending by tourists from outside Quebec. CED’s contribution primarily served to improve and fit up the big tent.
Economic Diversification Initiative for Communities Reliant on Chrysotile
In effect from June 11, 2013, to March 31, 2020, the Economic Diversification Initiative for Communities Reliant on Chrysotile (the Initiative) has a budget of $50M and is intended to assist communities and businesses in the Des Sources and Des Appalaches regional county municipalities (RCMs) in their efforts to transition to new economic activities.
The Initiative is implemented by CED in accordance with the terms and conditions of the Quebec Economic Development Program (QEDP).
The Initiative’s implementation is almost complete, and the budget has been fully committed.
Objectives
The goal of the Initiative is to support the economic transition of communities in the Des Sources and Des Appalaches RCMs affected by the shutdown of the chrysotile industry.
Who can submit projects?
The main eligible recipients are:
- small and medium-sized enterprises (SMEs);
- non-profit organizations (NPOs), including those whose core mission is business support; and
- municipalities and the Des Appalaches and Des Sources RCMs.
Funding
- SMEs: Repayable contributions
- NPOs (non-commercial projects): Non-repayable contributions
The Initiative has two components
1. Economic development projects submitted by businesses and organizations ($35M)
Funding is primarily awarded to SMEs that submit expansion or equipment acquisition projects, or projects involving the development of new services. Financial assistance for NPOs may, for example, be used to develop recovery plans or strategies to attract investment.
Example of a project:
CED has provided support for a project by a machinery manufacturer targeting the expansion of its plant and the acquisition of two new pieces of equipment (a laser cutter and a press brake). The project is part of a broad investment plan aimed at strengthening the business’s capacity to meet the demands of prime contractors in Quebec and better integrate into their value chains.
2. Public infrastructure projects ($15M)
Funding under this component targets such activities as the construction, repair and upgrading of public infrastructure (e.g., roads, drinking water treatment and distribution systems and industrial parks or motels) that supports the economic development of businesses or targeted communities.
Example of a project:
CED is funding a project to build a gas pipeline extension to supply natural gas to an industrial park so that companies currently operating in the area can convert to this form of energy.
Economic Recovery Initiative for Lac-Mégantic
Following the train accident that occurred on July 6, 2013, CED implemented the Economic Recovery Initiative for Lac-Mégantic (the Initiative) to support businesses and the community in Lac Mégantic. The Initiative, which has been extended until March 31, 2023, has a $35M budget and is carried out in accordance with the terms and conditions of the Quebec Economic Development Program (QEDP).
Objective
The objective of the Initiative is to provide support for the economic recovery and revitalization of Lac-Mégantic.
Who can submit projects?
- The town of Lac-Mégantic
- les Businesses and organizations in the region
- The Mégantic region Community Futures Development Corporation (CFDC)
Funding
Two types of funding are provided under this initiative: grants and contributions, with certain specific conditions:
- The assistance rate can be up to 100% of authorized costs for all projects (SMEs and NPOs), even though the maximum rate of assistance is usually 50% for SMEs and 90% for NPOs.
- CED may award non-repayable contributions of up to $500,000 to businesses and organizations conducting commercial activities, although contributions for business projects are usually repayable.
The Initiative has three components:
1. Town reconstruction projects
Up to $20M to restore, improve or build public infrastructure in the town of Lac Mégantic.
What projects are eligible?
- Development of economic recovery plans
- Implementation of initiatives designed to create new economic or business opportunities
- Restoration, enhancement or construction of public infrastructure
Example of a project:
CED is providing financial assistance for a project to redevelop Lac Mégantic’s downtown core. The project will include the construction of public infrastructure and the creation of parks, notably the former Musi-Café’s Espace Mémoire. The funding will support the municipality’s revitalization efforts.
2. Business and organization support projects
Up to $10M in direct assistance for businesses and organizations for the economic and commercial recovery of Lac-Mégantic.
What projects are eligible?
- Support for affected businesses
- Additional costs the affected businesses—mainly commercial businesses—would not have incurred had it not been for the disaster.
- Support for businesses with investment, innovation, marketing or productivity enhancement projects.
Example of a project:
CED provided funding to help a Lac-Mégantic business modernize and automate its stringing and soldering processes. The funding allowed the company to increase its production capacity and pursue its growth in the community.
3. Investment funds
Up to $5M for two local investment funds administered by the Mégantic region CFDC.
What projects are eligible?
- The first fund supports projects by the business community aimed at spurring economic activity in the town.
- The second fund supports the construction, repair and enhancement of community infrastructure.
Initiative for the Development of Economic Infrastructure in Quebec
Launched on August 27, 2019, the Initiative for the Development of Regional Economic Infrastructure in Quebec (the Initiative) promotes the economic development of Quebec communities through targeted investments in growth-generating projects that contribute to the vitality and attractiveness of the regions.
Unique to Quebec, the Initiative will last four years and a minimum of $10 million by component will be invested. It will be implemented through CED’s regular programs, namely, the Quebec Economic Development Program (QEDP) and the Regional Economic Growth through Innovation (REGI) program.
Purpose
The Initiative aims to support infrastructure projects that strengthen the economic development capacity of the regions.
Who may submit a project
The main eligible beneficiaries are:
- Municipalities, regional county municipalities (RCMs) and municipal corporations;
- Non-profit organizations (NPOs), infrastructure owners or managers;
- Tourism infrastructure businesses;
- Cooperatives, technology transfer centers, universities and colleges;
- Band councils, Indigenous administrations or authorities, or other Indigenous organizations.
Financial assistance
- For NPOs and government agencies (non-commercial projects), the contribution is non-refundable;
- For commercial NPO projects, the contribution is refundable.
The initiative includes three components
1. Transportation infrastructure
This component aims to support the construction, modernization or expansion of transportation infrastructure (airport, rail, port) projects that benefit SMEs and strengthen the regional economic ecosystem.
A minimum of $10 million will be invested in this component, through the QEDP.
2. Tourism infrastructure
This component aims to support the construction, modernization or expansion of tourism infrastructure projects likely to improve the attractiveness of regional tourism.
A minimum of $10 million will be invested in this component, through the QEDP.
3. Research infrastructure
This component aims to support equipment acquisition projects to foster the development of applied research and technology transfer to business initiatives.
A minimum of $10 million will be invested in this component through REGI.
CED’s Fast Forward Challenge
CED’s Fast Forward Challenge (the Challenge) is an entrepreneurial competition targeting engineering students and recent engineering graduates aimed at helping them carry out their business projects. Initiated by CED, the Challenge was implemented according to the adjusted terms and conditions of the Regional Economic Growth through Innovation (REGI) program.
The Challenge was held in the spring of 2019 and had a budget of $500K ($50K each for the 10 selected projects).
The competition is now closed. The recipients have been selected and announced, and CED is currently managing the agreements signed with them.
Objectives
The Challenge was an innovative pilot project designed to test one of the five new methods put forward by the Treasury Board to improve the delivery of its services to a client group that is atypical for CED. An evaluation is currently under way to determine follow-up, as required.
Who can submit projects?
To be eligible to participate, start-ups had to have been incorporated in Canada for less than three years; be based in Quebec; have at least two shareholders, including people aged 18 to 39 and engineering students; and be looking to market an innovation.
Funding
The funding awarded to the winning businesses took the form of a $50K grant. On August 30, 2019, 10 prizes were given out, for a total of $500K.
How it worked
The Challenge was carried out as a competition, with a call for proposals and an application evaluation process. Some 72 businesses from various regions of Quebec took part in the competition. Of these, 20 finalists were presented to a panel of experts on May 27 and 28, 2019.
Example of a project:
CED provided support for a business that had designed artificial intelligence-based software for municipal water management—i.e., a solution targeting at-risk water mains and a solution to predict water quality in real time—to help it fulfill its business plan.
Incubators and Accelerators Driven by Excellence (IADE)
Incubators and Accelerators Driven by Excellence (IADE) is an initiative that encourages Quebec incubators / accelerators to raise their level of performance in order to achieve the status of world class organizations. These organizations support young, innovative businesses with high growth potential (start-ups). Incubators and accelerators play a key role in the Quebec innovation ecosystem by providing essential support for start-ups at all stages of their existence (creation, development and growth); they act as nurseries for talent and innovation.
The IADE was developed by CED and draws on existing budgets in accordance with the terms and conditions of the Regional Economic Growth through Innovation (REGI) program.
A call for proposals launched under the IADE, which has a budget of $12M over four years, ran from May 6 to June 7, 2019. The recipient selection phase has been completed.
Objectives
The objectives of the IADE are to:
- bolster the capacity of the innovation ecosystem to support innovative start-ups with high growth potential; and
- help Quebec incubators and accelerators improve their services with a view to increasing the number of start-ups and further boosting their growth and improving their global competitiveness.
Who could submit projects?
To be eligible, the incubators and accelerators had to:
- be non-profit organizations (NPOs);
- be able to demonstrate that they were currently operating in Quebec; and
- have their head office in Quebec.
Under this initiative, priority was given to co-operative projects and projects that encourage the grouping together of some of the existing strengths of the start-up ecosystem to increase its impact and benefits.
Funding
Funding provided under this initiative took the form of non-repayable contributions.
Eligible activities
To be eligible, the activities put in place by the incubators and accelerators had to foster the innovative businesses’ growth and international competitiveness. These activities could include:
- consulting and support services;
- support to design new products and services or improve existing products and services;
- intellectual property training, information and support;
- strategy development (studies, diagnoses and action plans); and
- networking activities and business contacts.
Programs and initiatives in effect
| Programs and Initiatives | Acronym | Start Date | End Date | Process for submitting a project | Grants & Contributions Budget |
|---|---|---|---|---|---|
| Regional Economic Growth through Innovation | REGI | October 18, 2018 | N.A. | Continuously | $145.2M / 2019-2020 |
| Quebec Economic Development Program | QEDP | April 1, 2012 | N.A. | Continuously | $51.2M / 2019-2020 |
| Community Futures Program | CFP | 1995 | N.A. |
N.A. Renewed agreements |
$33.4M / year |
| Economic Development Initiative - Official Languages | EDI | 2018 | N.A. | Continuously | $1.8M / 2019-2020 |
| Women Entrepreneurship Strategy | WES | October 18, 2018 |
Entrepreneurship component: March 31, 2021 Ecosystem component: March 31, 2023 |
Calls for proposals completed |
$5.4M / 2.5 years $15.9M / 5 years |
| Steel and Aluminum Initiative | SAI | March 11, 2019 | March 31, 2020 | Call for proposals completed | $26.2M / 1 year |
| Canadian Experiences Fund | CEF | May 21, 2019 | March 31, 2021 | Call for proposals completed | $11.5M / 2 years |
| Canadian Initiative for the Economic Diversification of Communities Reliant on Chrysotile | -- | June 11, 2013 | March 31, 2020 | Continuously | $50M / 7 years |
| Funding for the economic recovery of the town of Lac-Mégantic | -- | August 8, 2013 | March 31, 2023 | Continuously | $35M / 10 years |
| Initiative for infrastructure development | -- | August 27, 2019 | March 31, 2023 | Continuously |
$79.5M / 4 years Under approval |
| CED Fast Forward Challenge | -- | February 8, 2019 | March 31, 2020 | Completed competition | $500,000 / 1 year |
| Incubators and Accelerators Driven by Excellence | IADE | May 6, 2019 | March 31, 2023 | Call for proposals completed | $12M / 4 years |
Industrial and Technological Benefits (ITB)
The goal of the Industrial and Technological Benefits (ITB) Policy is to optimize the economic benefits generated by government defence and security acquisitions valued at $100 million or more. It is not a grants and contributions program used by the government to fund projects; rather, through its procurement processes, the government favours bidders maximizing their domestic business activities.
Although the ITB Policy is the responsibility of Innovation, Science and Economic Development Canada, its implementation is partially assumed by the regional development agencies (RDAs). Building on their economic development mandate and their active presence in the regions, the RDAs promote opportunities associated with bidders’ ITB obligations, provide SMEs with strategic advice, and organize networking activities for companies of all sizes.
Objectives
The ITB Policy is linked to the Defence Procurement Strategy, which provides the framework for the procurement of equipment and services for the Canadian Armed Forces and the Canadian Coast Guard. Under the Policy, companies selected through the procurement process are required to undertake economic activities in Canada equal to the value of the contract.
The Policy specifies the type of benefits sought. The evaluation of bids received during procurement processes focuses in part on the value and quality of the proposed benefits to Canada. Once contracts are awarded, the government ensures that companies meet their ITB obligations.
The ITB policy aims to:
- foster the development of Canadian suppliers (the majority of which are SMEs) and their international growth;
- enhance innovation through research and development; and
- ensure the retention of a skilled workforce by improving skills development and training.
Considerations
In Canada, the ITB Policy has been applied to 144 procurement contracts since 1986, leading to the establishment of $47 billion in economic activity obligations. Of these, three-quarters have already been met.
A number of ITB investments have been made in Quebec. For example, in recent years, 30 large companies and prime contractors have invested in 80 defence procurement projects. Hundreds of SMEs and five Quebec research centres and educational organizations (McGill University, the École nationale d'aérotechnique, the École Polytechnique de Montréal, the Université de Sherbrooke and the École de technologie supérieure) have benefited from ITB investments. These investments were made in the aerospace (70%), land (21%), naval (8%) and space (1%) sectors.
CED is co-operating with the Government of Quebec, which is actively working to ensure that the Quebec defence sector—which accounts for approximately 28% of all defence sector jobs in Canada—can leverage the ITB Policy.
Current CED interventions
Unlike in other regions of Canada, the absence of a defence-specific industry association in Quebec means that the relevant RDA, CED, is called upon to assume a more important role as the lead for the ITB Policy and the promotion of business opportunities by:
- Acting as a business facilitator, through targeted networking involving prime contractors, Quebec companies and R&D centres, based on required capabilities. CED organizes regional tours and industry days;
- Informing and advising companies and research centres to allow them to seize business opportunities aimed at promoting their success both in Canada and abroad. For example, CED supports its clients by organizing trade missions to international trade shows;
- Encouraging information sharing with partners. CED manages a database of more than 700 SMEs that have defence sector capabilities; and
- Providing advice regarding the development of procurement processes and participating in the evaluation of bids as concerns the portion relating to the proposed benefits for Quebec.
3. Administrative Considerations
- Organizational structure
- Map of business offices
- CED’s budget
- CED in figures
- Legal framework
- Economic Development Agency of Canada for the Regions of Quebec Act
- Acts serving as a framework for CED’s operations
- Financial Administration Act
- Policy on Transfer Payments
- Bankruptcy and Insolvency Act and Creditors Arrangement Act
- Official Languages Act
- Lobbying Act
- Public Servants Disclosure Protection Act
- Public Service Employment Act
- Canadian Charter of Rights and Freedoms
- Access to Information Act
- Privacy Act
- Legal framework for the Agency’s financial activities
- Legislation impacting the legal relationship of the Agency and some clients
Organizational structure
CED’s organization chart
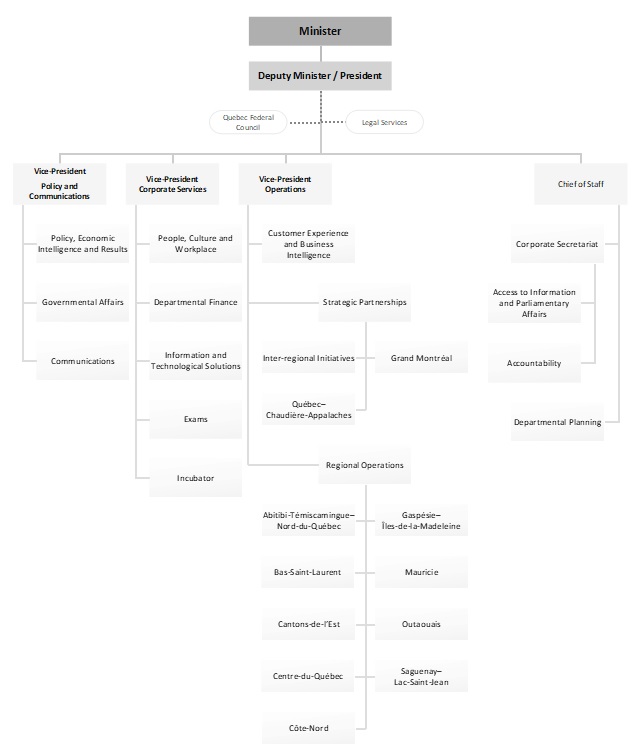
Text version:CED’s organization chart
Organizational chart demonstrating CED’s organizational structure. The Minister sits at the top of the chart, followed by the Deputy Minister/President (DM/P), who also chairs the Quebec Federal Council. Legal Services also fall under the DM/P’s responsibility. The Vice-President of Policy and Communications is responsible for the Policy, Economic Intelligence and Results, Governmental Affairs and Communications sectors; the Vice-President of Corporate Services is responsible for the People, Culture and Workplace, Departmental Finance, Information and Technological Solutions, Exams and Incubator sectors; and the Vice-President of Operations is responsible for the Customer Experience and Business Intelligence, Strategic Partnerships (Inter-regional Initiatives, Grand Montréal and Québec¿Chaudière-Appalaches) and Regional Operations (Abitibi-Témiscamingue¿Nord-du-Québec, Gaspésie¿Îles-de-la-Madeleine, Bas-Saint-Laurent, Mauricie, Cantons-de-l'Est, Outaouais, Centre-du-Québec, Saguenay¿Lac-Saint-Jean and Côte-Nord BOs) sectors, while the Chief of Staff is responsible for the Corporate Secretariat (Access to Information and Parliamentary Affairs, Accountability) and Departmental Planning. All four report to the DM/P.
Biographies of senior management
Deputy Minister / President
Manon Brassard
Deputy Minister / President
On June 7, 2016, the Prime Minister announced the appointment of Manon Brassard as President of the Economic Development Agency of Canada for the Regions of Quebec. Ms. Brassard took office on June 27, 2016.
From 2010 until 2016, Ms. Brassard held the positions of Assistant Deputy Minister at Citizenship and Immigration Canada (Corporate Services), Agriculture and Agri-Food Canada (Programs) and the Treasury Board Secretariat (Compensation and Labour Relations).
Ms. Brassard is returning to the Agency, where she was Vice-President of Operations from 2003 to 2010. Her extensive knowledge of the economic development of Quebec’s regions is a great asset for the organization and its mandate.
Ms. Brassard has a Bachelor of Law from Université Laval and is a member of the Barreau du Québec. She is also an accredited mediator.
Vice-President – Policy and Communications
Jean-Frédéric Lafaille
Vice -President, Policy and Communications
On July 2018, Mr. Jean-Frédéric Lafaille joined Canada Economic Development for Quebec Regions as Vice-President, Policy and Communications.
Mr. Lafaille started his career with the federal public service in 2003, while completing a doctorate in political philosophy at the University of Oxford.
He worked in policy and program development and implementation at the Department of Natural Resources Canada, where he was notably responsible for the restructuring of the nuclear Crown Corporation, Atomic Energy of Canada Limited.
From 2016 to 2018, Mr. Lafaille worked at the Privy Council Office as Assistant Secretary to the Cabinet, Special Projects. Reporting to the Deputy Clerk, Mr. Lafaille led interdepartmental governance to strengthen the federal government's ability to attract foreign investment to Canada.
Vice-President – Operations
Mark Quinlan
Vice-President, Operations
Mr. Mark Quinlan has served as Vice-President, Operations, at Canada Economic Development for Quebec Regions (CED) since July 2017.
Prior to that and for two years, he was the Regional Director General, Quebec Region, at Public Services and Procurement Canada (PSPC). Up to August 2015, he held the position of Director General of Real Property and Service Integration for the Canada Revenue Agency at PSPC. In 2012, Mark was appointed Executive Director, Strategic Reviews, reporting to the Associate Deputy Minister of PSPC.
Mr. Quinlan joined the public service in 2011 as Senior Director, Internal Services, within the Administrative Services Review Sector of the Privy Council Office.
He holds a Bachelor of Commerce from the John Molson School of Business (Concordia University), a Bachelor of Laws from the Université du Québec à Montréal and a graduate degree in notarial law from the Université de Sherbrooke.
Vice-President – Corporate Services
Guy Lepage
Vice-President, Corporate Services Sector
Guy Lepage has held the position of Vice-President, Corporate Services at CED since April 2017.
Prior to this, he was Regional Director of the Accommodation and Portfolio Management Directorate, Quebec Region, at Public Services and Procurement Canada.
From 2003 to 2013, Mr. Lepage held various management positions at the Société des casinos du Québec.
He holds a Master of Business Administration (MBA) from the Université du Québec à Montréal. In addition, he recently completed a program in finance and accounting for executives, offered by the Chartered Professional Accountants of Canada.
DM’s Office
Mandate and responsibilities
The Office of the Deputy Minister / President:
- Acts as the point of contact between CED’s administration and the Minister’s Office.
- Provides support services for the Minister and the Deputy Minister as concerns information, coordination and logistical requirements.
- Coordinates departmental files and provide professional advice and guidance on various high-profile files.
- Implements other initiatives supported by CED and the government.
Structure
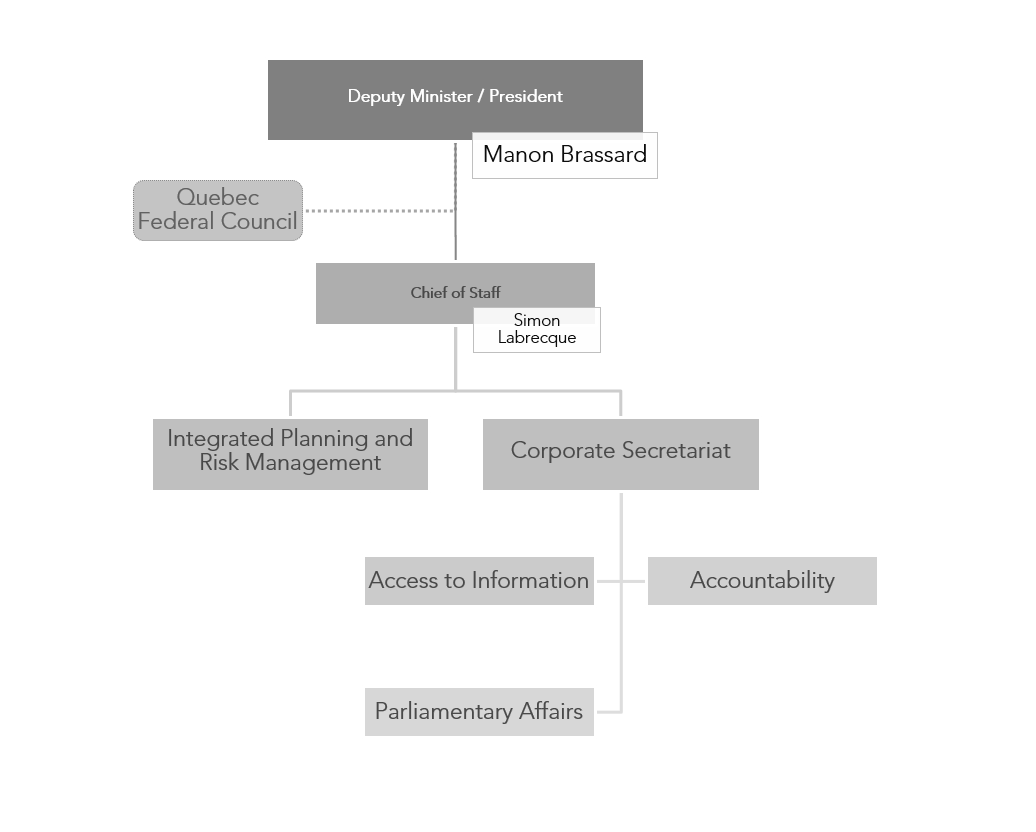
Text version:Deputy-minister structure organizational chart
Organizational chart demonstrating the organizational structure of the Office of the Deputy Minister/President (Manon Brassard). She chairs the Quebec Federal Council. She supervises the Chief of Staff (Simon Labrecque), who is responsible for Integrated Planning and Risk Management, and the Corporate Secretariat (Access to Information, Accountability and Parliamentary Affairs).
Key Activities
Chief of Staff
- The Chief of Staff is responsible for liaising between CED and the Office of the Minister, and acts as the primary point of contact.
- Provides the Deputy Minister / President and senior management with advice and guidance regarding departmental files, strategic decisions and the strategic planning of organizational resources.
- Supports the Deputy Minister / President in her role, which is to provide the Minister with timely support, guidance and strategic advice regarding CED’s policy and operational issues.
- Establishes partnerships and maintains relationships with the various economic development players in Quebec, including other federal and provincial departments.
Corporate Secretariat
- Coordinates parliamentary affairs, including written questions from MPs and reports to Parliament.
- Monitors the application of the Access to Information Act (ATIA) and the Privacy Act (PA).
- Coordinates responses to ministerial correspondence.
- Ensures the implementation of accountability exercises.
Planification, Modernization and Accountability
- Coordinates and advises the Deputy Minister / President on:
- the integrated departmental planning exercise, which includes establishing priorities and conducting quarterly follow-up.
- management of departmental risks, including mitigation strategies and quarterly follow-up.
- strategic reviews.
- Advises senior executives on best management practices and continuous improvement.
Quebec Federal Council
- Shares regional information and supports the Deputy Minister / President in the implementation of Government of Canada priorities.
- Establishes partnerships, leverages resources and seeks creative solutions to address shared issues.
- Works with stakeholders, exchanges knowledge and fosters co-operations among federal departments and agencies in Quebec.
Policy and Communications
Mandate and responsibilities
Guides, oversees and communicates CED’s programs and interventions in accordance with government priorities and Quebec’s economic reality, and maintains government relations.
Structure
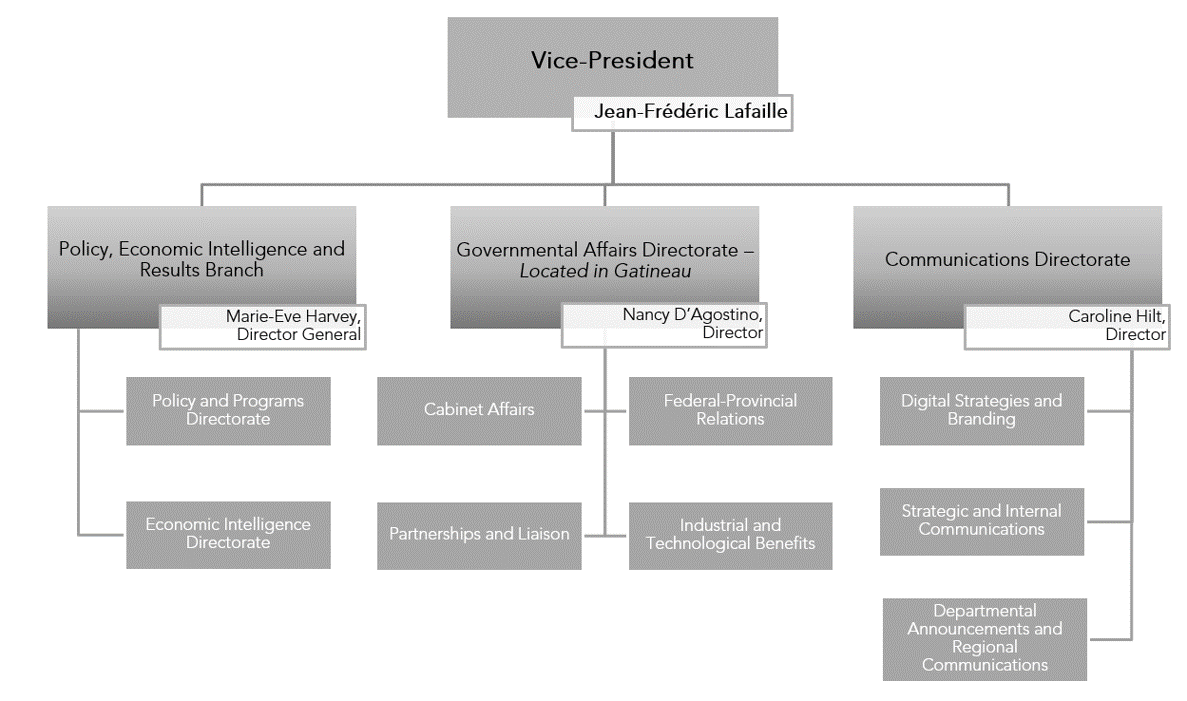
Text version:Policy and communications sector structure organizational chart
Organizational chart demonstrating the organizational structure of the Policy and Communications Sector. The Vice-President (Jean-Frédéric Lafaille) is responsible for the Policy, Economic Intelligence and Results Branch (Policy and Programs Directorate and Economic Intelligence Directorate), managed by Director General Marie-Eve Harvey; the Governmental Affairs Directorate – located in Gatineau (Cabinet Affairs, Federal-Provincial Relations, Partnerships and Liaison and Industrial and Technological Benefits), managed by Director Nancy D’Agostino; and the Communications Directorate (Digital Strategies and Branding, Strategic and Internal Communications and Departmental Announcements and Regional Communications), managed by Director Caroline Hilt.
Key Activities
Policy, Economic Intelligence and Results Branch
- Develops CED priorities, policies and programs for regional economic development
- Provides strategic monitoring of socio-economic trends and the issues and needs of businesses and communities that have an impact on their development
- Analyses CED’s interventions and results
- Supports business offices in the implementation of programs by developing various tools
Governmental Affairs Directorate
- Monitoring, analysis, representation and influence in relation to national priorities, policies and initiatives
- Cabinet Affairs: Strategic advice to support the participation of the minister, or ministers, in various cabinet committees
- Monitoring of Canada-Quebec relations: analysis of the priorities, orientations and policies of the Government of Quebec, and advisory services
- Implementation of the Industrial and Technological Benefits Policy in Quebec, in order to maximize spin-offs in defence and security procurement processes
Communications Directorate
- Ministerial announcements
- Digital presence (web & social media)
- Advisory services
- Media relations
- Employee communications
Priority Files 2019-2020
- Propose and design programs and initiatives that respond to departmental directions and government priorities (e.g., Throne speeches)
- Redesign the website based on the needs of Canadians
Operations
Mandate and Responsibilities
- Implements CED’s grant and contribution programs in all regions of Quebec within the framework of its incorporating legislation, relevant policies and government priorities
- Acts as a contributor and facilitator for SMEs and other key economic players in the regional ecosystem
Structure
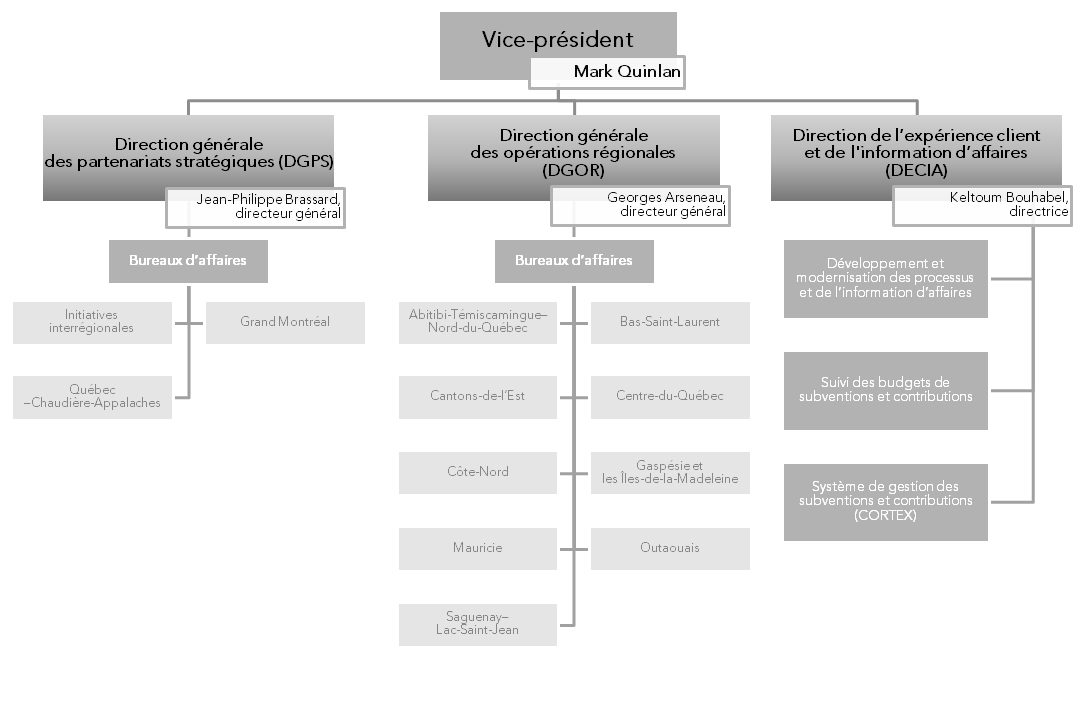
Text version:Operations sector structure organizational chart
Organizational chart demonstrating the organizational structure of the Operations Sector. The Vice-President (Mark Quinlan) is responsible for the Strategic Partnerships Branch (Business Offices: Inter-Regional Initiatives, Greater Montréal and Québec¿Chaudière-Appalaches), managed by Director General Jean-Philippe Brassard; the Regional Operations Branch (Business Offices: Abitibi-Témiscamingue¿Nord-du-Québec, Bas-Saint-Laurent, Cantons-de-l'Est, Centre-du-Québec, Côte-Nord, Gaspésie¿Îles-de-la-Madeleine, Outaouais and Saguenay¿Lac-Saint-Jean), managed by Director General Georges Arseneau; and the Client Experience and Business Information Directorate (Business Process and Information Development and Modernization, Grants and Contributions Budget Monitoring, and Grants and Contributions Management System), managed by Director Keltoum Bouhabel.
Key Activities
Strategic Partnerships Branch (SPB)
- Oversees coordination with business partners, gathers information on the ground and conveys it to the various sectors
- Directs and guides officials within the Greater Montréal, Québec–Chaudière-Appalaches and Inter-Regional Initiatives business offices to ensure the consistency of activities
- Ensures sector coordination to support the Policy and Communications Sector as concerns memoranda to Cabinet, Treasury Board submissions, intervention parameters, broad directions and key strategic documents
Regional Operations Branch (ROB)
- Provides direction and guidance to the nine regional business offices to ensure consistency of activities and alignment with priorities
Client Experience and Business Information Directorate (CEBID)
- Enhances client experience with program delivery (process development and modernization); supports decision-making business information; and maintains and modernizes the grant and contribution management system, including coordination with other regional development agencies
- Coordinates the planning and monitoring of grant and contribution and operating budgets
Key Files 2019-2020
- Implement programs and initiatives that are in line with departmental directions and government priorities
- Modernize the grant and contribution management system.
- Optimize work organization and modernize delivery objectives and project-based risk management
Corporate Services
Mandate and Responsibilities
Actively and jointly participate in the delivery of CED’s mandate by providing professional, agile, innovative and client-focused services for human, financial, administrative, information and technological resource management.
Structure
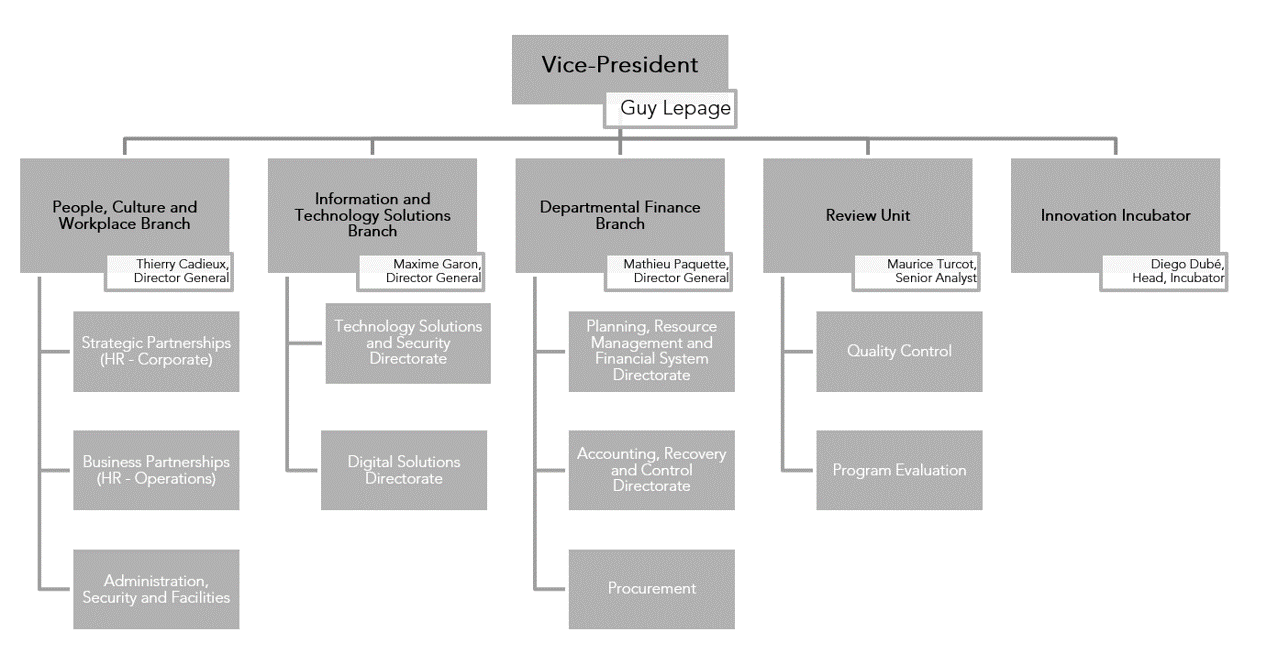
Text version:Corporate services sector structure organizational chart
Organizational chart demonstrating the organizational structure of the Corporate Services Sector. The Vice-President (Guy Lepage) is responsible for the People, Culture and Workplace Branch (Strategic Partnerships – HR Corporate, Business Partnerships – HR Operations and Administration, Security and Facilities), managed by Director General Thierry Cadieux; the Information and Technology Solutions Branch (Technology Solutions and Security Directorate and Digital Solutions Directorate), managed by Director General Maxime Garon; the Departmental Finance Branch (Planning, Resource Management and Financial System Directorate, Accounting, Recovery and Control Directorate, and Procurement), managed by Director General Mathieu Paquette; the Review Unit (Quality Control and Program Evaluation), managed by Senior Analyst Maurice Turcot; and the Innovation Incubator, managed by Incubator Head Diego Dubé.
Key Activities
People, Culture and Workplace Branch
- Provides services, advice and guidance on employee recruitment and retention, labour relations, compensation and workplace management in support of CED’s human resources, capital property and health and safety policies and programs, and a healthy, inclusive, modern and efficient work environment.
Information and Technology Solutions Branch
- Provides digital support and consulting services on technology solutions, information management, cybersecurity and IT project management.
Departmental Finance Branch
- Provides strategic advice on sound financial resource management and reporting in compliance with CED’s financial obligations.
Review Unit
- Conducts reviews (evaluations and audits) in order to provide information about the performance and management of CED’s programs for decision-making and accountability purposes.
Innovation Incubator
- Develops, through experimentation, new products or services that CED can integrate into its day-to-day operations to increase the satisfaction of its employees and/or clients.
Key Issues 2019-2020
As concerns central agencies
- Monitor legislative changes that have an impact on CED management, including:
- C-58 (An Act to amend the Access to Information Act and the Privacy Act and to make consequential amendments to other Acts);
- C-65 (An Act to amend the Canada Labour Code (harassment and violence)); and
- C-81 (An Act to ensure a barrier-free Canada).
- Review and begin implementing Treasury Board of Canada Secretariat’s initiatives, policies and guidelines relating to
- IT and information management, such as the Policy on Service and Digital; and
- people management, such as classification modernization, the next generation HR and pay system solution, and the new departmental security policy.
- Begin implementing the Office of the Comptroller General’s financial management initiative (SAP).
- Implement the Office of the Comptroller General of Canada’s audit plan.
Specific to our organization
- Support CED in the implementation of its priorities, notably by rolling out high-priority computer systems.
- Improve client experience within the organization in order to promote changes in the way corporate services are delivered, such as by
- integrating financial management advisors (FMAs); and
- increasing digital support for advisors while on travel.
- Pursue activities associated with the transformation into an organizational culture of innovation by creating a community of ambassadors who promote Incubator initiatives.
- Coordinate and maintain ISO certification.
Legal Services
The employees in CED’s Departmental Legal Services Unit report to the Department of Justice on an organizational, functional and professional basis.
Mandate and Responsibilities
Pursuant to the Department of Justice Act, the Departmental Legal Services Unit (DLSU) is responsible for ensuring that CED’s public affairs are administered in accordance with the law, as well as generally advising CED on all matters of law it refers to the DLSU. It provides relevant legal assistance and advice regarding all CED activities.
Structure
Text version:CED departmental legal services unit structure organizational chart
Organizational chart demonstrating the organizational structure of Legal Services. The Department of Justice Canada supervises the Departmental Legal Services Unit to which report the Economic Development Agency of Canada for the Regions of Quebec (3 advisors), the Canadian Space Agency (3 advisors) and the Atlantic Canada Opportunities Agency (3 advisors).
Key Activities
Provides CED with legal advice in all its areas of activity:
- Specifically, in the fields of commercial and public law (e.g., insolvency, the environment, Indigenous consultations and official languages);
- on all other aspects, including human resources management, program development through memoranda to Cabinet or Treasury Board submissions, and legal risk management;
- drafts funding agreement templates and special conditions for higher-risk cases;
- protects the Crown’s interests in the event of disputes;
- provides CED with advice and guidance on internal policies, programs and guidelines;
- represents the Agency in legal proceedings before the courts;
- develops and provides training.
Key Issues 2019-2020
- Investigation into anti-dumping and countervailing duties on steel and aluminum.
- Softwood lumber dispute.
- Investigation into anti-dumping and countervailing duties in the wind turbine sector.
- LGBTQ class action litigation.
Map of business offices
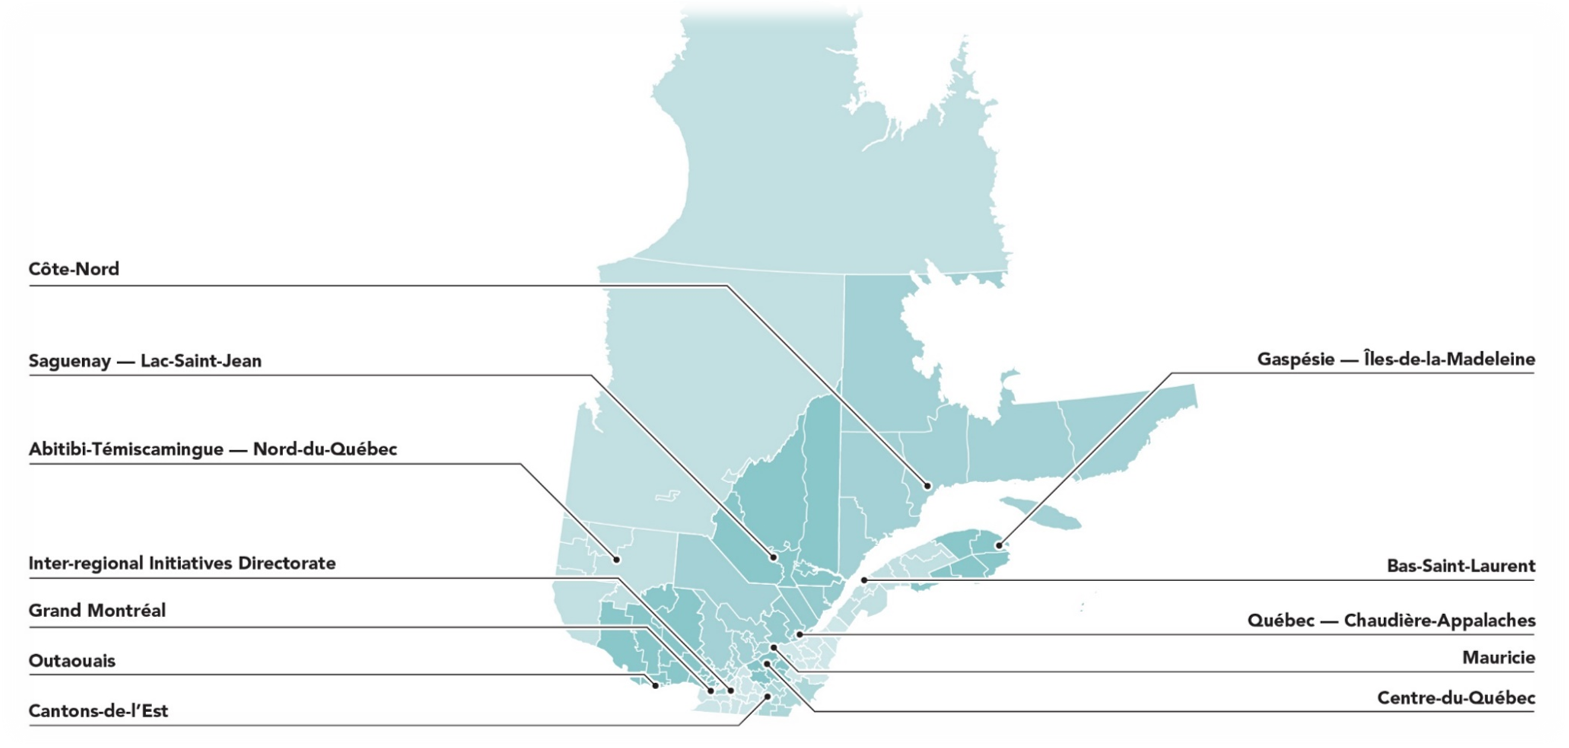
Text version
Map of Quebec with the territories served by the business offices.
CED’s budget
| (millions of dollars) | Approved Budget 2019–2020 |
|---|---|
| Operating expenses – salary | 31.7 |
| Operating expenses – non-salary | 7.7 |
| Grants and Contributions | 278 |
| Regional Economic Growth through Innovation (REGI) program | 160.7 |
| Quebec Economic Development Program (QEDP) | 50.8 |
| Community Futures Program (CFP) | 29.0 |
| Steel and Aluminum Initiative | 26.2 |
| Canadian Economic Diversification Initiative for Communities Reliant on Chrysotile | 4.6 |
| Women Entrepreneurship Strategy | 3.9 |
| Economic Recovery Initiative for Lac-Mégantic | 1.0 |
| Linguistic Duality | 1.8 |
| Statutory Items – Employee Benefit Plan | 4.8 |
| TOTAL (in line with the 2019-2020 Departmental Plan) | 322.2 |
| Supplementary funding and transfers, approved and/or pending approval, following publication of the 2019–2020 Departmental Plan | 10.8 |
| Infrastructure | 8.0 |
| Launch of a federal strategy on employment and tourism | 4.2 |
| 5% budget carry-forward from the previous year | 1.7 |
| Women Entrepreneurship Fund (national stream) | 1.7 |
| Artificial intelligence | 0.5 |
| Mont Mégantic Observatory | 0.5 |
| Lac-Mégantic bypass | 0.3 |
| Transfer to Fisheries and Oceans | -6.0 |
| Various items | -0.1 |
| TOTAL BUDGET | 333.0 |
Data based on the 2019–2020 Departmental Plan.
| (millions of dollars) | Approved Budget (3 years) | ||
|---|---|---|---|
| 2020-2021 | 2021-2022 | 2022-2023 | |
| Operating expenses (salary and non-salary) | 38.8 | 37.4 | 37.4 |
| Grants and contributions | 199.9 | 199.9 | 199.7 |
| Statutory items | 4.8 | 4.6 | 4.6 |
| SUBTOTAL (in line with 2019–2020 Departmental Plan) | 243.5 | 241.9 | 241.7 |
| Supplementary funding and transfers, approved and/or pending approval, following publication of the 2019–2020 Departmental Plan | 81.5 | 20.7 | 20.8 |
| TOTAL BUDGET | 325.0 | 262.6 | 262.5 |
The variance between the 2020–2021 and 2021–2022 budgets is primarily due to $51.2 million in repayable contribution reimbursements. Every year, the CED contribution budget increases as a result of client repayments. Official approval of the amount of the budget increase is obtained annually.
| Planned FTEs* | |||
|---|---|---|---|
| 2019-2020 | 2020-2021 | 2021-2022 | 2022-2023 |
| 342 | 337 | 333 | 333 |
* Does not take into account initiatives for which approval is pending. Data based on 2019–2020 Departmental Plan.
CED in figures
CED's Workforce
- CED delivers on its mandate with the help of its 342 full-time equivalents (FTEs), which make up 0.1% of the total federal public service workforce.
- Representation at CED:
Type % Number WFA Women 64% 224 +24 Visible minorities 12% 43 -5 Persons with disabilities 4% 13 -1 Indigenous peoples 1% 3 -5 - 97% of the workforce identified French as their first language and 3% identified English.
- The average age of CED employees is 44.4, which is similar to the average age in the public service as a whole (44.18).
- Executive positions (EX) account for 5% of the workforce.
- 77% of positions at CED require post-secondary education.
Breakdown of the CED Workforce
- 4% – Office of the Deputy Minister / President
- 20% – Policy and Communications Sector
- 34% – Corporate Services Sector
- 41% – Operations Sector
- 1 Head Office and 1 Business Office (BO) – Montreal
- 1 Parliamentary Affairs Office – Gatineau
- 11 BOs in the regions of Quebec
Approved Projects
| Main Aggregate Indicators | April 1, 2018, to March 31, 2019 | April 1, 2019, to July 25, 2019 |
|---|---|---|
| Number of Projects | 575 | 438 |
| Total Contributions ($M) | 242.6 | 354.8 |
| Total Project Costs ($M) | 1,730.2 | 1,207.6 |
| Estimated No. of Jobs Created and Maintained | 5,490 | 3,803 |
| Number of Communities | 223 | 176 |
| Number of Individual Clients | 563 | 430 |
| Number of Repayable Projects | 349 | 162 |
| Value of Repayable Projects ($M) | 146.4 | 57.0 |
| Number of Non-Repayable Projects | 226 | 276 |
| Value of Non-Repayable Projects ($M) | 96.3 | 297.8 |
| Annual Budget Received ($M) | 249.9 | 277.7 |
| Annual Budget Spent ($M) | 249.9 | 80.6 |
Legal framework
Economic Development Agency of Canada for the Regions of Quebec Act
Context
- The purpose of the Economic Development Agency of Canada for the Regions of Quebec (theAct) is to:
- promote the development and diversification of the economy of the regions of Quebec (section 3 of the Act);
- create the Agency;
- establish the roles and responsibilities of the Agency, those of the Minister and those of the President.
- The Act describes the activities assigned to the Agency. The financial and human resources allocated to the Agency must be used solely for activities consistent with its objective.
- The Agency may perform any other function that may be assigned to it by order of the Governor in Council (section 11(2) of the Act).
Considerations
The Agency
The Agency’s mission is to promote the long-term economic development of the regions of Quebec by giving special attention to those where slow economic growth is prevalent or opportunities for productive employment are inadequate (sections 8 and 10 of the Act).
The Agency has the authority to make grants and contributions in support of programs and projects undertaken by the Agency or the Minister (section 11(1)(h) of the Act).
The Agency has the authority to make grants and contributions in support of programs including stipulating the financial conditions in contract agreements linking it to a client and that complies with Treasury Board policies.
The Agency plans, implements, directs and manages programs intended to contribute to the establishment, development, support and promotion of enterprises, as well as to the development of communities (section 11 of the Act).
It can conclude contracts, memoranda of understanding or other arrangements in the name of Her Majesty in right of Canada or in the name of the Agency, including cooperation agreements and agreements related to distinct sectors of Quebec’s economy (sections 11(1)(i) and 15 of the Act).
The Agency assists the Minister generally, in the exercise of powers assigned to the Minister under this Act and any other Act (section 12 of the Act).
The Minister
The Minister guides the policies and programs of the Government of Canada in relation to the development and diversification of the economy of the regions of Quebec (section 4 of the Act).
The Minister leads the activities of the Government of Canada in the establishment of cooperative relationships with Quebec and with business, labour and other public and private bodies in that province (sections 4, 5, 6 and 7 of the Act).
The Minister presides over the Agency and the President (section 5(1) and 9(2) of the Act).
The President
The President is the deputy of the Minister, and is the chief executive officer of the Agency and has control and supervision over the work, officers and employees of the Agency (section 9 of the Act).
She is the deputy head of the Agency pursuant to the Public Service Employment Act (section 18(8) of the Act) and the Financial Administration Act (section 16.1 of the Financial Administration Act). This means that some of the powers and obligations are incumbent on her directly.
Reports
Every five years, a report on the Agency’s activities in applying this Act is submitted by the President to the Minister, who lays it before each House of Parliament (section 17 of the Act).
Relevant legislative tool
The complete text of the Act may be consulted on the Department of Justice Canada’s website at the following address: https://laws-lois.justice.gc.ca/eng/acts/E-1.3/index.html.
Acts serving as a framework for CED’s operations
Financial Administration Act
Context
One of the fundamental principles of Canadian constitutional law is that Parliament controls public money and that the State cannot spend it without Parliament's approval.
The Financial Administration Act (the Act) contains detailed provisions for the collection and expenditure of public funds. It sets out the fundamental principles involved in the organization of the State, public money, public spending, public debt, public property and public accounts. It also sets out the various remedies to be applied when government employees or third parties fail in their responsibilities.
Considerations
The Agency is a department within the meaning of the Act, as it is listed in Column I of Schedule I.1 of the Act.
The Act confers rights and obligations on the Minister. It also confers rights and obligations to the President of the Agency as deputy head.
These are the authorities and responsibilities granted to the President of the Agency and of the Minister under the Act:
Human resources management (section 12)
- The deputy head (the President) has the authority to hire, terminate or demote a federal employee. The Minister does not have such authority.
Internal audit (section 16.1)
- The President, who is the accounting officer within the meaning of the Act, ensures that specific measures are taken to conduct internal audits within the Agency.
Accounting Officer (section 16.4)
- The President, as deputy head, is accountable before the appropriate committees of the Senate and the House of Commons.
- The Act provides for a dispute resolution process if a minister and an accounting officer disagree on the interpretation or application of certain policies, directives or standards established by the Treasury Board.
Debt write-off regulations (section 25)
- In accordance with section 25 of the Act the Debt Write-off Regulations (1994) (SOR/94-602). They prescribe the criteria for determining whether any debt, obligation or claim may be written off, and the information and records to be kept.
- The Minister, or any officer authorized in writing by the Minister, in writing may write off from the Agency’s a debt or part of a debt that has been deemed uncollectible. At the Agency, this task is usually delegated to the Deputy Minister/President.
Public disbursements (sections 31, 32, 33 and 34)
- Responsibility for control and spending of public money is given to the Minister and to the President by Parliament.
- The Act governs all aspects of government spending and applies to all financial authorities.
Contracts (sections 41 and 42)
- These are the provisions that stipulate the conditions under which contracts may be awarded by the Crown or its ministers.
Deduction and set-off (section 155)
- The Act provides for a mechanism to facilitate the recovery of debt between various departments or agencies through set-off.
- When a client of the Agency owes money to the Agency and, on the other hand, another department must pay money to that same client, it may be possible to obtain from the other department the payment of the amounts that were to be forwarded to that client.
Failure to comply with the Act (sections 80 and 81)
The Act also includes a section on offences and punishment for non-compliance. The offences referred to in the Act include offences committed by public officers involving theft, fraud or corruption.Relevant legislative tool
The complete text of the Act can be consulted on Justice Canada’s Web site at this address: https://laws-lois.justice.gc.ca/eng/acts/f-11/
Policy on Transfer Payments
One of the Agency’s key activities is the delivery of grants and contributions to businesses or organizations for projects that will have an impact on the establishment, development, support and promotion of businesses and the development of communities in Quebec.
The various grants and contributions programs are implemented in accordance with the Treasury Board Policy Framework and, more specifically, in accordance with the Policy on Transfer Payments. Treasury Board may approve the terms and conditions for new grants and contributions programs and projects $20M and above.
Context
- The Agency’s contribution agreement programs are developed in accordance with the Treasury Board’s Policy on Transfer Payments (PTP) and its Directive on Transfer Payments (DTP).
- The objective of the PTP is to ensure that transfer payment programs are managed with integrity, transparency and accountability.
- Transfer payments are monetary payments made to third parties on the basis of an appropriation. Transfer payments do not result in the acquisition by the Government of Canada of any goods, services or assets. There are two categories of transfer payments at the Agency: grants and contributions.
- The PTP requires departments to take a risk-based approach to the design and delivery of programs, and program administration and auditing requirements.
- Special attention is given to official language communities in that official language requirements must always be taken into consideration and met when transfer payment programs and funding agreements are developed.
- The duties and responsibilities pertaining to the design, implementation and management of transfer payment programs are clearly defined at all levels (Treasury Board, President of the Treasury Board, ministers and deputy head).
- The PTP gives ministers greater leeway to manage grant and contribution programs within their departments. It also gives deputy heads monitoring and reporting responsibilities.
Considerations
Minister’s Responsibilities:
- following an assessment or a review of the relevance and effectiveness of Agency programs, the Minister is authorized to approve a continuation of the terms and conditions (in other words, keeping the terms and conditions as is).
- at the request of the Minister, on the basis of a satisfactory report on departmental performance, the Treasury Board may authorize the Minister of the Agency to approve amendments to terms and conditions. The Agency must consult with the Treasury Board before the Minister can exercise this authority.
President’s Responsibilities:
- Ensuring that Agency programs are and will remain relevant and effective:
- by establishing a performance measurement strategy in the program design stage, which is maintained and updated throughout the program's life cycle.
- by assessing the relevance and effectiveness of programs every five years and by implementing appropriate measures that take assessment results into account.
- Ensuring that monitoring, internal control, performance measurement and reporting systems are in place to support the management of transfer payments.
- Ensuring, when appropriate, the harmonization of transfer payment programs within the Agency, and ensuring collaboration with other departments.
- Providing the Treasury Board Secretariat, by April 1st of each year, with a three-year plan that outlines planning for new programs, continuation of old programs, amendments and cancellations, and initiatives to encourage proponents and recipients to participate. A summary plan should be made available to the public (on the Agency’s Internet site).
The complete text of the PTP and DTP may be consulted on the Treasury Board Secretariat’s website at the following addresses:
Bankruptcy and Insolvency Act and Creditors Arrangement Act
Context
The Bankruptcy and Insolvency Act (BIA) and the Companies’ Creditors Arrangement Act (CCAA) are federal acts that set out the rules for debtors experiencing financial problems.
In the context of the Agency, some clients in financial difficulty may benefit from the protection mechanisms under the BIA and the CCAA to reduce their debt burden.
Under the BIA, insolvent debtors may declare bankruptcy or make a proposal to their creditors.
Bankruptcy is an assignment of property made to a bankruptcy trustee by an insolvent debtor. The trustee must sell property and apply the proceeds of the sale to pay off debts.
A proposal is an offer to creditors to pay a percentage of what is owed over a specific period of time, or to extend the amount of time to pay off the debt, or a combination of both. Creditors vote to accept or reject the proposal. The creditors must vote on whether to accept or reject the proposal. If the majority of creditors reject the proposal, the debtor is then bankrupt.
Once all of the terms of the proposal are met, the debtor is legally released from the debts included in the proposal.
The CCAA includes mechanisms similar to those in the BIA, but it only applies when insolvent companies have debts exceeding $5 million and want to restructure.
The Office of the Superintendent of Bankruptcy oversees the administration of bankruptcies, proposals and arrangements under the BIA and the CCAA.
Considerations
Agency clients can decide to avail themselves of the BIA or the CCAA.
Occasionally, it may be their creditors that take action under these acts, as they may file a bankruptcy petition in court in an effort to recoup as much as possible of the amounts owed them. Under these circumstances, the Agency, as a creditor, must follow the course of the bankruptcy, proposal or arrangement.
The Agency, as an unsecured (or occasionally secured) creditor, may have a role to play in a bankruptcy, proposal or arrangement. For example, the Agency may:
- participate in and vote at creditors’ meetings;
- appoint inspectors;
- act as inspector;
- inform the trustee of any irregularity on the part of the debtor.
Relevant legislative tools
The complete text of both Acts may be consulted on the Department of Justice Canada’s website at the following addresses:
Official Languages Act
Context
The intent of the Official Languages Act (the OLA), enacted by the federal government, is to:
- ensure, in accordance with the Constitution, the equal status of English and French in Parliament and before the courts established by Parliament (Parts II and III of the OLA);
- give Canadians the right to communicate with and receive services from the federal government in either English or French in the National Capital Region and any place where, under the terms of the Official Languages (Communications with and Services to the Public) Regulations, there is significant demand or the specific circumstances justify it (Part IV of the OLA);
- give federal government employees the right to work in the official language of their choice in the National Capital Region and in those regions designated as bilingual for the purposes of language of work (Part V of the OLA);
- guarantee equal employment and career advancement opportunities in federal institutions for English- and French-speaking Canadians, and commit federal institutions to hiring, subject to the merit principle, English- and French-speaking Canadians in numbers that reflect their proportion in the overall Canadian population) (Part VI of the OLA); and
- require federal institutions to take positive measures to promote the English and French languages in Canadian society and enhance the vitality of official language minority communities and support their development (Part VII of the OLA).
The Commissioner of Official Languages enforces the Act within federal institutions. He ensures that the language rights of Canadians are respected and promotes linguistic duality and bilingualism (Part IX of the OLA).
If any Canadian, including a federal public servant, whether on his/her own account or on behalf of a group or community, deems that the rights guaranteed by the Act have not been respected, he/she may file a complaint to the Commissioner (Part IX of the OLA). If a complainant is not satisfied with the results of the Commissioner’s investigation, he/she has the option, under the OLA, of recourse to the courts.
In Quebec, the Charter of the French Language makes French the official language of Quebec. This law does not apply to federal departments. It applies to most organizations funded by the Agency, including the creation of specific public posting requirements.
Considerations
The President of the Agency, as Deputy Head, is responsible for the administration and enforcement of the OLA, as well as the implementation of resulting policies;
All branches of the Agency are involved, directly or indirectly, in applying the OLA;
The business offices of Greater Montreal, Outaouais, Gaspésie—Îles-de-la-Madeleine, Cantons-de-l'Est, Côte-Nord, Mauricie, Abitibi-Témiscamingue, Inter-regional Initiatives Directorate and Quebec—Chaudière-Appalaches must actively offer communications and provide services to the public in both official languages;
The Agency must be cautious when using this approach, as many of the organizations covered by it are subject to the obligations of the Charter of the French Language, which requires them to give precedence to French in terms of public signage.
Relevant legislative tool
The unabridged version of the OLA may be consulted on the Department of Justice Canada’s website at:
https://laws-lois.justice.gc.ca/eng/acts/O-3.01/FullText.html
Lobbying Act
Context
The purpose of the Lobbying Act (the Act) is to increase transparency in the lobbying of public office holders, including federal public sector employees, members of Parliament, senators and their staff. The Act is also aimed at providing accountability to sustain trust in the integrity of government decision making.
The Act applies only to lobbyists who are paid for their activities and provides for two categories of lobbyists: consultant lobbyists and in-house lobbyists. People who are lobbying on a voluntary basis are not required to register. The onus is on the lobbyist to comply with the Act.
The Act defines activities that, when carried out for compensation, are considered to be lobbying. Generally speaking, they include communicating with public office holders with respect to:
- changing federal laws, regulations, policies or programs;
- obtaining a financial benefit such as a grant or contribution;
- obtaining a government contract;
- in the case of consultant lobbyists, arranging a meeting between a public office holder and another person.
The Registry of Lobbyists is the principal means provided under the Act to ensure transparency with regard to lobbying. It is available free for online searching at https://www.ocl-cal.gc.ca/en/. The Registry contains detailed information about lobbyists and their activities.
Five-year prohibition on lobbying
The Act prohibits former designated public office holders (including the Minister or Minister of State and that person’s office staff, and the Deputy Minister) and former designated members of the Prime Minister’s transition teams from lobbying during a period of five years after they cease to carry out those responsibilities.
Investigations
The Act provides for the appointment of a Commissioner of Lobbying, who is an independent Agent of Parliament with authority to enforce the Act and the Lobbyists’ Code of Conduct (Code).
Lobbyists’ Code of Conduct
The purpose of the Code is to assure the Canadian public that lobbyists are required to adhere to high ethical standards with a view to conserving and enhancing public confidence and trust in the integrity, objectivity and impartiality of government decision-making.
Considerations
- The Agency has put internal mechanisms in relation to the Act in place and uses control measures that ensure compliance.
- The Commissioner of Lobbying can ask designated public office holders, including ministers and ministers of state, to verify information on communications for the purpose of lobbying registered by lobbyists.
- Designated public office holders are therefore advised to keep a record of meetings with lobbyists so that they will be able to answer questions from the Commissioner of Lobbying.
Operational Aspects
From the beginning of the exchanges between the Agency and a potential client, the Agency determines whether the other person seems to qualify as a lobbyist or not. If this is the case, the Agency directs the contact to the appropriate resources at the Office of the Commissioner of Lobbying.
The Agency requires a declaration from its clients that, in the event that a person acts for the client as a lobbyist, that person acts in good standing with the provisions and requirements of the Lobbying Act.
The Agency does not analyze client funding applications and does not enter into an agreement with a client that appears to be in violation of the Act. As well, it verifies the use of the clients of lobbyists throughout a project, for example through claim and help application forms.
Relevant legislative tools
The full-text versions of the Act and the Code are available on the Justice Canada’s website at: https://www.ocl-cal.gc.ca/en/
Public Servants Disclosure Protection Act
Context
The Public Servants Disclosure Protection Act (the Act) gives federal public sector employees a secure and confidential process for disclosing serious wrongdoing in the workplace, as well as protection from acts of reprisal.
It is part of the Government of Canada's ongoing commitment to promoting ethical practices in the public sector.
Considerations
- In the specific context of the Agency, the intent of the Act is to encourage Agency employees, acting in good faith, to report information concerning possible wrongdoing in their work environment.
- It does not supersede other existing recourse mechanisms such as grievances, harassment complaints or staffing complaints.
- It applies to serious acts.
- It provides employees with a clearly defined process.
- It ensures that employees who disclose such information are treated fairly and are shielded from reprisals in a manner consistent with law.
Relevant legislative tool
The complete text of the Act may be consulted on the Department of Justice Canada’s website at the following address:
Public Service Employment Act
Background
- The Public Service Employment Act (the Act) sets out the responsibilities of the Public Service Commission (PSC) regarding recruitment and hiring in the federal public service.
- The PSC may delegate some of these responsibilities to deputy heads of departments. The Act promotes an approach based on the fundamental values of merit (which the Act defines) and political impartiality, the guiding values of fairness, access and representativeness, and the ability to serve the public with integrity and in either official language. The Act also establishes recourse mechanisms for resolving staffing issues.
Considerations
- The Act confers rights and obligations on the PSC, which has delegated most of these to the Agency’s president, except for audit rights, those exempted from the application of the Act, regulatory powers and investigative powers.
- Therefore, authority under this Act at the Agency can be exercised only by the president and by the managers to whom the president has subdelegated certain authority. The Act gives the Minister no authority in matters pertaining to public service employees as such.
Relevant legislative tool
The full-text version of the Act is available on the Justice Canada website at http://laws-lois.justice.gc.ca/eng/acts/P-33.01/.
Canadian Charter of Rights and Freedoms
The Charter is part of the Constitution of Canada. The Charter sets forth the rights and freedoms that Canadians consider essential for maintaining a free and democratic society.
Some of the rights and freedoms contained in the Charter are:
- freedom of expression;
- the right to a democratic government;
- the right to live and to make a living anywhere in Canada;
- the rights of individuals charged with offences;
- Indigenous rights; the right to equality, including equality between men and women; regardless of race, national or ethnic origin, colour, religion, sex, age or mental or physical disability;
- the right to use either of Canada's official languages;
- the right of English and French linguistic minorities to instruction in their language;
- the protection of Canada’s multicultural heritage.
Relevant legislative tool
The full-text version of the Act is available on the Department of Justice Canada website:
Access to Information Act
Context
The Access to Information Act (ATIA) has been significantly amended. Most of these changes came into effect on June 21, 2019.
The purpose of the ATIA is to enhance the accountability and transparency of federal institutions in order to promote an open and democratic society and to enable public debate on the conduct of those institutions. In this regard, Part 1 of the ATIA broadens access to federal government records by recognizing the right of the public to disclosure. Any compelling exceptions to this right must be specific and limited, and decisions on disclosure of information are subject to independent recourse. Part 2 of the ATIA sets out requirements for the proactive publication of information.
The term “record” is defined in the ATIA as: any documentary material, regardless of medium or form.
The ATIA, appoints an Office of the Information Commissioner whose mandate is to impartially examine the decisions of government entities concerning access to records. The commissioner’s role is to ensure compliance with this law. The commissioner may, in particular, authorize a government institution in writing to decline to act on an access to information request that is vexatious or made in bad faith, to make inquiries and order a government institution to disclose certain documents in whole or in part.
The ATIA stipulates that all records must be made available unless there are specific exceptions from disclosure. Sections 13 to 26 and section 69 of the ATIA set out the circumstances in which Agency may or must refuse to release a record.
For example, the Agency should not release records if:
- they were obtained in confidence from other governments (section 13);
- they concern federal-provincial relations (section 14);
- disclosure might jeopardize the safety of individuals (section 17);
- disclosure would harm Canada’s economic interests (section 18);
- the information is personal as defined in the Privacy Act (section 19);
- the information was obtained in confidence from third parties (e.g. financial, commercial, scientific or technical details) or where disclosure would be likely to entail significant financial losses or profits to third parties or adversely affect their competitive position (section 20);
- respecting advice prepared by or for a government institution and account of consultations involving employees of a government institution (section 21);
- where they concern reviews or audits, release of which would harm the Agency’s operations or skew its results (section 22);
- information protected by solicitor-client privilege or the professional secrecy of advocates and notaries or to litigation privilege. (section 23);
- the information is protected under other federal legislation (section 24);
- the record is due for release (in whole or in part) within 90 days after the request is made (section 26);
- they contain Cabinet confidences (section 69).
Part 2 of the ATIA deals with the proactive disclosure of information and requires the publication of information such as travel expenses, hospitality expenses, reclassification of a staffed position, contracts over $10,000, grant or contribution agreements over $25,000 and all briefing documents (transitional workbooks) prepared for the future deputy head.
The ATIA also provides that each minister must, among other things, have the transitional workbooks, the title and reference number of each memorandum, the notes prepared for the Minister's intention for the question period, the briefing materials for parliamentary committees and information on travel and hospitality expenses.
The exemptions provided for the disclosure of information under sections 13 to 26 of Part 1 of the ATIA apply to documents that are the subject of proactive disclosure under Part 2 of the ATIA.
Considerations
- Ministers and deputy heads are required to ensure that their organizations comply with the ATIA.
- Under the ATIA, the President, as head of the government institution, has authority over the protection of personal information. The President has delegated some of those ATIA-related authorities to the officers identified in the delegation schedule.
Relevant legislative tool
The complete text of the ATIA may be consulted on the Department of Justice Canada’s website at the following address:
https://laws-lois.justice.gc.ca/eng/acts/A-1/page-1.htmlPrivacy Act
Context
The Privacy Act (PA) gives citizens the right to access personal information held by the government and protects that information against unauthorized use and disclosure.
Under this Act, the Office of the Privacy Commissioner has been instituted, with a mandate to examine impartially the decisions of government entities on access to records and issues of privacy protection. Its role is to ensure compliance with the Act, and in furtherance of this, they may ask the Federal Court to intervene.
Amendments were made to the PA on June 21 to, among other things, create a new exception to the definition of personal information with respect to certain information relating to ministerial adviser and ministerial staff.
General Principles
- Disclosure of personal information without the consent of the individual concerned is prohibited;
- The definition of personal information, regardless of form and medium, is any information pertaining to an identifiable individual relating to that person’s:
- race;
- national or ethnic origin;
- colour;
- religion;
- age;
- family status;
- education;
- employment history;
- the views or opinions of another individual about the individual; or
- financial transactions in which the individual has been involved.
Considerations
- Ministers and deputy heads are required to ensure that their organizations comply with the PA;
- Under the PA, at the Agency, as the head of the government institution, it is the President who has authority over the protection of personal information. The President has delegated some of those PA-related authorities to the officers identified in the delegation schedule.
Relevant legislative tool
The complete text of the PA may be consulted on the Department of Justice Canada’s website at this address:
https://laws-lois.justice.gc.ca/eng/acts/P-21/page-1.html#h-397182
Legal framework for the Agency’s financial activities
Obligations of the Agency with respect to National and International Trade Agreements
Context
Some international agreements are relevant to the Agency’s activities.
Main Agreements
- Agreement Establishing the World Trade Organization (WTO Agreement), of which the General Agreement on Tariffs and Trade 1994 and the Agreement on Subsidies and Countervailing Measures are integral parts.
- North American Free Trade Agreement (NAFTA) and Canada-United States-Mexico Agreement (CUSMA)
- NAFTA is an agreement between Canada, the United States and Mexico.
- Although NAFTA is still in effect, it is important to note that on November 30, 2018, Canada, the United States and Mexico signed the new Canada-United States-Mexico Agreement (CUSMA). Parties are currently undertaking their domestic process toward the ratification and implementation of the CUSMA.
- Canadian Free Trade Agreement
- This is an intergovernmental trade agreement signed by all the premiers of the provinces, territories and Canada and came into force on July 1, 2017.
- This agreement replaces the Agreement on Internal Trade (AIT) which came into force in 1995.
- Softwood Lumber Agreement between the Government of Canada and the Government of the United States of America (SLA)
- Agreement between the Government of Canada and the Government of the United States of America covering trade in softwood lumber (e.g., sawn coniferous wood).
- The agreement ended on Monday, October 12, 2015.
- Canada and the United States are continuing negotiations on this issue
Constitution Act, 1982, and Aboriginal consultations
Context
Section 35 of the Constitution Act, 1982 has the effect to give constitutional status and protection to the existing Aboriginal rights and treaty rights of the Aboriginal peoples of Canada (Indian, Inuit and Métis peoples of Canada).
The Supreme Court of Canada has described several times the duty to consult flowing from this statute.
Considerations
Duty to Consult
- The Government of Canada, in carrying out its activities, must respect potential or established Aboriginal or Treaty rights by consulting with Aboriginal groups whose rights and related interests may be adversely impacted by a proposed Government of Canada activity. In certain cases, the Government of Canada also has a duty to accommodate Aboriginal peoples.
- Aboriginal and treaty rights include hunting, fishing, timber harvesting, gathering of foods and traditional medicines and other activities arising from a custom, practice or tradition forming an integral part of the distinct culture of the Aboriginal group.
- The duty to consult and accommodate is part of a process of fair dealing and reconciliation that begins with the assertion of sovereignty by the Crown.
- When the Agency plans to fund a project, it must ensure that the project will not impact or negatively impact the rights or interests of Aboriginal peoples.
- In consultation with the department responsible for Aboriginal Affairs, the Agency has established criteria to ensure timely consultation with Aboriginal peoples. During the Aboriginal consultation process, the Agency may, among other things:
- Notify the Aboriginal group(s) of the proposed activity, and provide a government contact for any questions or concerns;
- In a timely manner, provide Aboriginal groups with clear and relevant information on the proposed activity and any adverse impacts that may be anticipated;
- Consider the concerns of Aboriginal groups, and respond in a meaningful way by ensuring that the Agency’s responses consider and address Aboriginal representations, questions and concerns;
- Depending on the nature of the concerns, ensure that the third-party proponent is involved in the discussion of measures to prevent or reduce any potential adverse impacts of the project.
- Aboriginal consultation may reveal a need to accommodate, and this accommodation may take several forms. The purpose of accommodation is to harmonize conflicting interests, avoid irreparable harm to rights, and avoid the depletion of the resources that are the subject of the claims. The Agency should work with Aboriginal groups to identify solutions that balance the interests of the Aboriginal groups with the societal interests of all Canadians. The basis of reasonableness is assessed on the adequacy of the accommodations.
- The duty to consult does not include an obligation for the Agency to agree with Aboriginal groups on how the concerns raised during consultations will be resolved. However, all parties must make reasonable efforts to find solutions that will accommodate the adverse impacts of the project on potential or established Aboriginal or Treaty rights.
- The following are examples of accommodation measures that have already been used by the Agency in the context of a grant or contribution project:
- Changes to the project design;
- Reach an agreement with the proponent to commit in carrying out measures designed to reduce the adverse impacts or to compensate the Aboriginal group;
- Follow up on environmental monitoring as part of the project.
- When accommodation measures are implemented, the Agency must monitor these measures and ensure that they mitigate or eliminate the adverse impacts of the project.
Operational Aspects
- For project analysis purposes, when it is determined that a project requires Aboriginal consultation, a relevant process is put in place. The Agency generally carries out these consultations itself, in co-operation with federal and provincial partners that work with the First Nations in question (e.g., CIRNAC or the SAA). Based on the information and representations gathered during the consultations, CED can require that changes be made to the projects originally submitted, or can include special conditions in the agreements with the clients. This process may cause varying delays depending on the complexity of the project and the degree of co-operation on the part of the client.
- In recent years, this obligation has had an impact on the following projects:
- 2016–2017: 8 projects, 2 of which involved consultations with communities
- 2017–2018: 5 projects, 3 of which involved consultations with communities
- 2018–2019: 2 projects
Relevant legislative and policy tools
There are principles governing the Government of Canada's relationship with Aboriginal peoples. This document is available on the Department of Justice Canada website at:
https://www.justice.gc.ca/eng/csj-sjc/principles-principes.html
Impact Assessment Act
Context
The Impact Assessment Act (IAA) and its regulations came into force on August 28, 2019. The IAA repeals the Canadian Environmental Assessment Act, 2012.
The Impact Assessment Act provides as follows:
- It names the Impact Assessment Agency of Canada as the authority responsible for impact assessments.
- It establishes a process for assessing the environmental, health, social and economic effects of designated projects with a view to preventing certain adverse effects and promoting sustainability. It may also prohibit proponents from going ahead with a designated project if the project in question is likely to cause certain environmental, health, social or economic effects.
- Projects are designated either by regulations (listed) or by order of the Minister of the Environment.
- The IAA provides for the assessment of the environmental effects of non-designated projects being carried out on federal lands or outside Canada.
- Federal lands include lands that belong to Her Majesty in right of Canada, and all waters on and airspace above those lands, inland waters, and surrendered lands or any other lands that have been set apart for the use and benefit of a band and that are subject to the Indian Act, and all waters on and airspace above such lands.
Part 2 of the Impact Assessment Act provides, among other things, for the creation of the Canadian Energy Regulator and repeals the National Energy Board Act. Part 3 of the Impact Assessment Act amends the Navigation Protection Act.
Considerations
- When the Agency analyzes an application for project funding, it must determine whether the project is a designated project; a project taking place on federal lands; or a project being carried out outside Canada.
- In the case of a designated project, the Agency or the proponent will need to consider several factors before deciding whether the project can go ahead and what measures apply (e.g., the Impact Assessment Agency of Canada decides that the project does not require an impact assessment, or the proponent takes steps in accordance with the conditions set out in a statement provided by the Minister of the Environment).
- In the case of a project being carried out on federal lands or outside Canada, the Agency will need to take a number of factors into account before granting project-related funding (e.g., whether or not the project is likely to cause significant adverse environmental effects, taking into account, among other things, any adverse impact that the project may have on the rights of Canada’s Indigenous peoples, and mitigation measures that are technically and economically feasible).
- As the implementation by decree is recent, more information regarding its application is expected soon.
Relevant legislative tool
The unabridged version of the Act may be consulted on the Department of Justice Canada’s website at:
Legislation impacting the legal relationship of the Agency and some clients
Act respecting the Ministère du Conseil exécutif (M-30)
Context
The Act respecting the Ministère du Conseil exécutif, commonly called Bill M-30, was adopted by the Government of Quebec in 1964.
Bill M-30 is a Quebec law that imposes certain prerequisites on affected organizations wishing to enter into agreements with the Government of Canada.
Essentially, any organization that receives more than 50% of its funding directly or indirectly from the Government of Quebec or the majority of the members of whose board of directors is appointed directly or indirectly by the Government of Quebec may be subject to Bill M-30. The criteria are defined in sections 3.11 and 3.12 of Bill M-30, and the organizations that meet the various criteria in the Act are then identified as a “municipal body,” “school body” or “public agency.”
Organizations that are subject to Bill M-30 cannot enter into an agreement with the Government of Canada, (a federal department or agency or a federal public body) until they have obtained the authorization of the Government of Quebec, in the form of an order in council or prior authorization depending on the circumstances of each case. These provisions of Bill M-30 came into force in 1984.
Consequently, any entity that is subject to Bill M-30 is responsible for obtaining such authorization before signing any agreement with the Government of Canada.
Considerations
- Many of the Agency’s clients are subject to Bill M-30, such as municipal organizations and some public bodies.
- Umbrella decrees were issued to allow for the conclusion of a funding agreement without the need for subject organizations to obtain specific prior approvals.
- The umbrella decrees bearing the numbers 805-2018 and 225-2019 constitute, to the extent that the conditions of these decrees are respected, prior authorizations allowing certain organizations subject to Bill M-30 to enter into funding agreements with the Agency.
- These funding agreements provide that subject organizations must: “comply with all acts, regulations and orders applicable to the Client, the Project and the activities ensuing therefrom, including the Act respecting the Ministère du Conseil exécutif (Chapter M-30) . . . ”.
- Under the terms of Bill M-30, the absence of a prior authorization otherwise required by law invalidates the agreement.
Relevant legislative tool
The complete text of Bill M-30 can be consulted on the Publications du Québec Web site at this address:
Legal regime of cities and municipalities
Context
Through its programs, the Agency provides financial assistance to cities and municipalities.
The Municipal Code of Quebec, the Cities and Towns Act and the Municipal Powers Act include provisions used by the Quebec National Assembly to govern the powers of cities, municipalities and regional county municipalities (RCMs) in Quebec.
The contracting process conducted by cities and municipalities is also subject to certain legislative and regulatory provisions.
Considerations
The Agency's funding agreements provide that recipients, including cities and municipalities, must: “comply with all acts, regulations and orders applicable to the Client, the Project and the activities ensuing therefrom, including the Act respecting the Ministère du Conseil exécutif (chapter M-30), the Municipal Powers Act (Chapter C--47.1) . . .”.Relevant legislative tools
The complete versions of the Municipal Code of Québec, the Cities and Towns Act and the Municipal Powers Act can be consulted at the following addresses:
4. Ministerial Services
- Cabinet affairs
- Parliamentary affairs
- Ministerial communications
- Social media
- Travel
- Access to Information
- Information technology
- Ministerial security
- Policies for Ministers' Offices
Cabinet affairs
Support for the Minister’s participation in Cabinet committees
The Canada Economic Development for Quebec Regions (CED) Cabinet Affairs Unit (CAU) supports the Minister’s participation in Cabinet committees on which he/she sits by preparing briefing notes that provide perspective on the implications of Cabinet proposals for Quebec and/or CED.
If you hold the portfolio to which CED belongs or if you are a Minister of State, CED will coordinate with the other department. If necessary, an additional message will follow.
Cabinet committees
The Minister responsible for CED sits on various Cabinet committees. The terms of reference and composition of these committees are decided upon by the Prime Minister.
The Minister receives a copy of the agenda of Cabinet committee meetings, generally along with a briefing note on each topic discussed at these meetings.
The CED CAU, with the support of the Privy Council Office, provides the Minister with electronic copies of meeting agendas and briefings (E-Cabinet).
Support for the Minister
The CED CAU reviews Cabinet committee agenda items and oversees the preparation of required briefing books. The Minister is given speaking points on both the items submitted by CED and those from other federal departments and agencies attending the meetings of the Cabinet committees on which he/she sit.
Parliamentary affairs
The Parliamentary Affairs team of the Deputy Minister/President's Office supports you in the following parliamentary activities:
- Questions on the Order Paper (Written Questions)
- Oral Questions (Question Period)
- Adjournment Proceedings (Late Show)
- Parliamentary Committees
Oral Questions (Question Period)
- A press review and issue analysis are conducted before 8:00 am each morning of the week to determine whether key messages need to be written or updated to prepare for Question Period in the House of Commons.
- If necessary, these key messages are provided in the morning, in the form of bilingual notes maximum two pages long.
Question on the Order Paper (Written Questions)
- Members’ questions on the Order Paper are assigned to CED by the Privy Council Office when the House of Commons is in session.
- Questions on the Order Paper require a response from the Government within 45 days. This timeframe is outlined in the House’s Standing Orders.
Adjournment Proceedings
- On occasion, Opposition MPs request an adjournment debate on a response provided during Question Period.
- The Parliamentary Affairs team coordinates the preparation of Adjournment Proceedings speeches in conjunction with your office.
Parliamentary Committees
- You and your officials are sometimes called to appear before parliamentary committees, particularly during the tabling of budget documents.
- The Parliamentary Affairs team coordinates the production of documents upon receipt of an invitation to appear related to CED’s activities, as soon as this invitation is received.
- These documents must be disclosed proactively no later than four months after the appearance.
Ministerial communications
CED supports you in your public relations activities related to CED’s mandate. This includes announcing funding agreements, launching new programs or initiatives, participating in public events, media relations and communicating with CED employees.
CED provides advice, guidance and ongoing communications support to showcase CED’s contribution to government objectives and priorities. Communications activities enable you to highlight your urban and rural regional development objectives and mark the achievement of projects adapted to regional realities.
Announcements
You will have the opportunity to announce grants and contributions that support the main priorities of your government and that many Quebec companies and organizations receive through CED programs.
- The announcement of project funding may take the form of a press conference, photo opportunity or press release.
- To maximize visibility, CED will recommend an approach that takes into account the context, public environment and media market.
- For example, we could propose the grouping of several projects under the same theme to ensure greater media coverage.
- CED handles the logistics surrounding the announcement and provides communications materials in both official languages.
- Depending on the format of the announcement, this material may include speaking notes, a press release, a sequence and a media advisory.
- This material is included in a briefing book submitted before the event.
- Logistics: CED will coordinate with clients and partners, invite media and ensure the smooth execution of the announcement that same day.
- CED ensures that the activity is published on its social media accounts and in a press release.
Launch of new programs or initiatives
Launches usually include an announcement. In addition to the items in the preceding section, a communications plan is developed, as are content for the CED website, key messages and a social media plan; there is also the opportunity to broadcast the event live on the Web.
MP Kits
When appropriate (for example, for a large number of similar local announcements), CED provides a kit to support MPs in their participation in public events on your behalf.
This kit usually includes:
- A guide on public announcements
- An Event Notification Form
- A checklist
- Sample documents, including for the media advisory, news release, speaking notes and scenario
Participation in public events
CED also supports you in your participation in public events related to CED’s mandate, whether organized by CED or its partners (speech at a convention, inauguration, informal discussions, etc.).
Media relations
In addition to coordinating media requests for its activities, CED identifies proactive media relations opportunities and potential issues. This includes providing advice and guidance, developing responses and recommending a spokesperson. CED also liaises with your office and other departments and agencies as appropriate.
Communications with CED employees
CED proposes establishing and maintaining an active link with employees located in all of its business offices through a structured offer. In addition to advice and guidance, this can take the form of personalized ministerial events or messages on special occasions (your arrival, the Holidays, National Public Service Week, etc.) or important milestones (launching new initiatives or programs, publication of the Departmental Results Report, etc.).
Social media
This factsheet is intended to help you distinguish between CED’s official social media accounts and personal or partisan accounts.
Official accounts
CED’s official accounts are used to communicate CED policies, programs, announcements and initiatives. Created and managed by public servants, these official accounts must not contain any partisan symbols, identifiers or content.
CED resources should only be used to manage, create or modify content for use on the Government of Canada’s official channels of communication (e.g., print media, social media accounts, mobile applications and websites). These resources include employees, networks and devices.
In order to avoid being perceived as supporting or endorsing a particular political party or partisan message, CED must not follow the personal or partisan social media accounts of ministers or members of Parliament, nor share their content, mention them or otherwise create hyperlinks to them.
Personal and partisan accounts
Ministers and MPs may maintain personal and/or partisan social media accounts that are distinct from Governments of Canada accounts.
Ministers may choose to use their personal or partisan social media accounts to communicate or highlight content posted on government accounts and websites, or to insert hyperlinks in their accounts that lead to government websites when such content is equally accessible to external users.
Ministers must avoid using in their personal or partisan social media accounts anything that may be confusing and imply that they are Government of Canada accounts. For example, they should avoid using their official title in the names of their accounts and should not use Government of Canada symbols, identifiers or even hyperlinks to Government of Canada websites—including pictures of officials—in their templates and personal profiles.
Ministerial Correspondence
The Corporate Secretariat in the Office of the Deputy Minister / President is responsible for handling ministerial correspondence. Ministerial correspondence refers to all letters, memos or emails addressed to the Minister or the Deputy Minister / President of Canada Economic Development for Quebec Regions (CED), as well as documents prepared at their request or requiring their signature.
For you and the members of your Office, the Corporate Secretariat:
- receives and sends mail;
- coordinates the drafting of responses, in cooperation with your Office, which provides instructions regarding the action to be taken;
- ensures quality control of all correspondence to be brought to your attention;
- coordinates file searches;
- acts as a liaison regarding CED’s correspondence activities and those of other departments, notably other regional development agencies, when the subject matter has a broader scope than just CED; and
- manages the correspondence system.
Deadlines for correspondence received that requires
- an acknowledgement of receipt: 5 business days
- a detailed response: 20 business days
Travel
Travel within Canada
Minister
Prior approval must be obtained from the Prime Minister’s Office for all travel in Canada outside the National Capital Region.
Exempt staff
Travel expenses must be authorized in advance by the Minister or his/her Chief of Staff. Expenses incurred by the Chief of Staff must be authorized by the Minister or CED’s Chief Financial Officer (CFO). Travel expense claims must be reviewed by the CFO.
Travel abroad
Minister
Prior approval must be obtained from the Prime Minister’s Office for all travel outside Canada.
The Minister’s travel is governed by the Treasury Board’s Special Travel Authorities and the Policies for Ministers’ Offices.
You must use Public Services and Procurement Canada’s (PSPC) Shared Travel Services (STS) when booking travel related to departmental business.
Your travel expenses are paid out of your office’s budget.
You will be required to certify that the expenses were incurred as part of official business.
Exempt staff
Your approval is required for international travel. Expenses must be reviewed by the CFO, both when prior approval is granted and when the claim is submitted.
Minister’s staff
Your office staff must comply with the provisions of the Treasury Board’s Special Travel Authorities and the Travel Directive. Bookings must be made through STS.
These expenses are chargeable to your operating budget.
Administrative assistant
The administrative assistant is responsible for handling travel requests and travel expense claims.
Voluntary disclosure
Ministers, parliamentary secretaries and all exempt staff are required to post, on their department’s website, all travel expenses incurred while carrying out government business on behalf of CED.
Access to Information
Context
The Access to Information and Privacy Office (AIPO) is part of the Agency’s Corporate Secretariat. Under a delegation order, the AIPO represents CED as the entity responsible for:
- Access to information requests;
- Consultations from other federal institutions;
- Informal requests (copies of previous requests);
- Privacy requests;
- Privacy impact assessments.
Access to information requests
- Any organization or individual residing in Canada may file an access to information request with a government institution under the Access to Information Act.
- Requests must be processed within 30 calendar days unless there are exceptions that may justify an extension such as consultation of a third party or other institutions or the extent of the documents covered by the request.
- Once a request is received and the AIPO acknowledges receipt to the requester, the process is as follows:
- The request is directed to the appropriate sector, namely the Office of Primary Interest (OPI), which collects and gathers the relevant records.
- The AIPO reviews the documents provided, conducts all necessary consultations with the OPI, other government departments or third parties, and applies any exemptions, if needed, under the Act.
- A notice of disclosure is sent to the OPI, the Communications Directorate, the Deputy Minister’s / President’s Chief of Staff and your office to describe the actions taken to process the request and to provide a copy of the release package. A period of three business days is provided to raise any issues prior to the release of the documents to the requester.
- The final response is then sent to the requester.
Consultations from other federal institutions
Any federal institution that has received an access to information request may consult CED if the information is under the control of the Agency. The desired response time is indicated in the request and will usually range from five to fifteen business days.
The AIPO reviews the documents and consults the OPI and the Deputy Minister’s / President’s Chief of Staff to make recommendations on the release of the records.
Informal requests
Through proactive disclosure, CED publishes the summaries of access to information requests that have been completed each month. Anyone can then make an informal request for the records that were released.
Upon receipt of such requests, the AIPO sends a copy of the release package as well as a notice of disclosure to the OPI, the Communications Directorate, the Deputy Minister’s / President’s Chief of Staff and your office. A period of three business days is provided to raise any issues prior to the response being sent to the requester.
Monitoring of access to information requests
To keep track of access to information requests that are being processed, a report is sent to all managers, the Communications Directorate, the Deputy Minister’s / President’s Chief of Staff and your office on a weekly basis.
Documents relevant to an access request
- Admissible
- Any paper, computer, audio or visual elements (correspondence, agendas, invoices, post-its, emails, cellphone content, USB keys, videos, voice messages, photographs, etc.);
- Documents prepared by the office relating to an administrative decision;
- Correspondence between two offices that is administrative in nature (e.g., contribution).
- Excluded by the Access to Information Act
- Cabinet confidences.
Commonly used exemptions
- Information obtained in confidence from other government offices (s. 13)
- Federal-provincial relations (s. 14)
- Personal information — identifiable individual (s. 19)
- Third-party commercial information (s. 20)
- Operations of government (s. 21)
- Solicitor-client privilege (s. 23)
Values and ethics
Under section 67.1(1) of the Access to Information Act, no person shall, with intent to deny a right of access under the Act, destroy, mutilate or alter a record; falsify a record or make a false record; conceal a record; or direct, propose, counsel or cause any person in any manner to do anything mentioned in the above.
Information technology
Information technology (IT) is an integral part of CED’s daily operations. You and your office will be given computer and electronic equipment to help you carry out your work. The Corporate Services’ IT unit will supply this equipment and provide support regarding its use and the performance of departmental activities.
Computer equipment
CED will provide you and the members of your office with a set of IT tools and electronic access controls for use during your mandate.
- Hardware includes:
- a tablet with a keyboard and a mouse;
- a smart phone;
- one printer per office; and
- a videoconference system.
Electronic access includes:
- network access (including access to data storage spaces);
- an email account;
- an encrypted key for secure data transmission; and
- access to various software programs, including remote access software.
Given the public nature of your duties, the acceptable use and protection of information are of paramount importance. You and your staff have responsibilities in this regard. Therefore, upon taking up your positions, you will be informed of the various risks and responsibilities associated with the use of the various technologies.
IT support
The IT team will hold information sessions for all your staff members on using and understanding the IT tools and applications.
Specific equipment for Cabinet committees
Members of Cabinet committees, including the Treasury Board, have access to additional equipment designed to ensure the security of information shared within this group. Privy Council Office staff and members of the internal departmental security teamwill inform you about this equipment and its acceptable use.
Other equipment
Some of your duties, including your work as an MP, will require the use of different equipment and networks. This physical separation is needed to ensure a strong democratic process and to separate the role of public servants from that of exempt staff.
Cybersecurity
Information theft, phishing attempts and hacking are realities that you may be confronted with as soon as you take up your mandate. An information session on cybersecurity will be given by designated CED staff members to provide you with information and tips on how to protect your information.
Relevant policy instruments and legislation
Ministerial security
Departmental security supports the delivery of reliable Government of Canada programs and services, as well as the protection of information, individuals and property.
Several stakeholders play a role in this regard:
CED’s responsibility
The deputy head, the chief security officer and other designated individuals at CED are responsible for all aspects of security. A designated person acts as a liaison officer with the Royal Canadian Mounted Police (RCMP) in matters relating to the personal safety of the Minister, and provides advice and guidance on all security-related matters:
- Coordinating validation of security clearances of exempt staff.
- Providing advice, guidance and briefing to your office.
- Supporting and implementing the Policy on Government Security.
- Liaising with the RCMP and taking required action for potential risks and for travel.
Responsibilities of the Royal Canadian Mounted Police (RCMP)
The RCMP is responsible for the physical protection of ministers and for providing security and risk assessment consulting services as needed.
- Physical protection of ministers: The RCMP makes an emergency number (24/7) available to you and the departmental security office, and provides additional protection in the event of a specific threat.
- Consultations on security and risk assessment as needed.
Your responsibilities and those of your office
- Holding a Level 2 (Secret) security clearance or higher for all staff before the first day of work
- Complying with requirements for the protection of government personnel, information and assets
- Attending a security briefing provided by designated CED staff
Relevant policy and legislative instruments
- Policies for Ministers' Offices – Part 2
- Policy on Government Security – Direction to manage government security
- Directive on Security Management – Effective Management of Government Security Measures
Policies for Ministers' Offices
5. Government Operations
- Parliamentary reporting cycle
- Memoranda to Cabinet and Treasury Board Submissions process
- Federal government financial and reporting cycle
- Values and ethics
- Proactive disclosure
- Information management
- Acronyms
Parliamentary reporting cycle process
The Reporting team in the Office of the Deputy Minister / President coordinates the production and tabling of the following departmental reports to Parliament:
- Departmental Plan
- Departmental Results Report (DRR)
- Report to Parliament
Departmental Plan
- Forward-looking document outlining plans and priorities for the coming fiscal year and the two subsequent fiscal years, as well as planned resources to achieve results.
- Departmental Plans must be tabled in Parliament every year on or before March 31. The President of the Treasury Board is responsible for tabling them in Parliament on behalf of the various departments.
- The final document is forwarded to you for approval and signature in February at the latest.
Departmental Results Report (DRR)
- Report outlining departmental results and performance for the most recently completed fiscal year, in line with the Departmental Plan covering the same fiscal year.
- DRRs are generally tabled in Parliament in November of each year. The President of the Treasury Board is responsible for tabling DRRs on behalf of all departments.
- The final document is forwarded to you for approval and signature, usually in September.*
* Because of the Fall 2019 election, 2018–2019 DRRs will be tabled at a later date, either at the end of 2019 or in early 2020. This will have an impact on the report approval date.
Report to Parliament
- Under its enabling legislation, CED must produce a report once every five years providing an overall evaluation of its activities.
- The upcoming report will cover the period from April 1, 2016, to March 31, 2021.
- This five-year report provides a brief overview of CED’s recent achievements, as well as its new priorities and initiatives that will transform these achievements into results for the regions of Quebec. The report complements the Departmental Plan and the DRR tabled annually in Parliament.
- The final document will be presented to you by December 31, 2021. You must table a copy of the report in each House of Parliament on any of the first 15 days on which that House is sitting after you receive the report.
Memoranda to Cabinet and Treasury Board Submissions
Cabinet and its committees constitute the forum where ministers collectively make decisions on government policy, strategies and initiatives. Ministers propose measures for study by their colleagues. When Cabinet ratifies decisions, this gives ministers the authority to implement their proposals.
- A Memorandum to Cabinet (MC) is a document to seek a Cabinet decision on a proposed measure.
The Treasury Board (TB) is the oldest Cabinet committee of the Government of Canada and the only statutory Cabinet committee established under the Financial Administration Act.
- A TB Submission (TB Sub) requests approval to implement a program or initiative; this document generally provides detailed information on planned expenditures and expected results.
The government decision-making process determines the need to develop and submit an MC or TB Sub, based on orientations stemming from the Speech from the Throne, elements in ministerial mandates (often triggering MCs) and the federal budget cycle (triggering TB Subs).
MCs are generally required to approve any new policy or program or to obtain additional funding, or when any policy or program is changed substantially. Management of the MC process is subject to the decision and directives of the Privy Council Office (PCO).
TB Subs provide program and spending authorities to implement new initiatives or programs or to make amendments to existing ones. Management of these submissions is subject to the decision and directives of the TB Secretariat (TBS).
CED’s role
CED leads the drafting of MCs and TB Subs concerning the Agency. CED provides support to you and your office throughout the Cabinet process—including dealing with central agencies (PCO, Finance Canada and TBS) to represent and advance your proposals. CED works closely with PCO and TBS to determine the need for an MC or TB Sub, the type of authorities required, and any necessary documents (full or slim TB Subs or MCs).
CED and with the other regional development agencies (RDAs) are also consulted on numerous MCs and TB Subs where there are regional elements at play to assess what role they could play in the delivery of these MCs or TB Subs, or to provide clarity on any potential impacts on their mandate or respective region (provincially, regionally or locally). All RDAs participate in these discussions when the initiative or program being considered is horizontal or national in scope.
CED may need an MC or TB Sub to modify the terms of its programs, to renew certain agreements (e.g. support for international organizations), or to obtain authority to implement special initiatives.
With respect to CED’s existing regular programs, TB Subs are required for any project over $20M under the Regional Economic Growth through Innovation (REGI) program, and for any project over $10M under the Quebec Economic Development Program (QEDP).
Usually close to three months is needed, from the moment CED receives the signal to draft an MC or TB Sub to when they receive final approval or ratification. However, critical pathways may vary considerably depending on the urgency or complexity of the subject.
Federal government financial and reporting cycle
Text version
Timeline chart
Beginning of the cycle
Planning for the fiscal year begins well before April 1, with the preparation of CED’s budgetary priorities. In its Departmental Plan, CED outlines its plans and priorities for the coming fiscal year and the two following years.
Pre-budget consultations by the Standing Committee on Finance are also held during this period. This committee may report on its pre-budget consultations for the upcoming fiscal year by mid-December, and may influence organizations’ expenditure plans.
The Budget
The Government’s efforts to reconcile its spending obligations and revenue projections are reflected in the Budget. The Budget outlines the government's fiscal, social and economic policies and priorities, while the Main Estimates set out, in detail, its projected expenditures for the upcoming fiscal year. Typically, the Budget is presented in the second half of February.
Main Estimates and Supplementary Estimates
The expenditure plans are submitted to the House in their consolidated form as the “Main Estimates.” Normally, the Main Estimates are tabled in the House of Commons, and are submitted for concurrence by the House no later than June 23.
Because they are tabled so close to the Government’s annual budget, it is not always possible to include detailed budget-related plans and priorities in the Main Estimates document.
Should there be a change in the Government’s requirements as set out in the Main Estimates over the course of the year, Parliament may be asked to approve Supplementary Estimates. The Government can submit as many Supplementary Estimates as it deems necessary over the course of a fiscal year. In recent years, there have typically been two or three Supplementary Estimates per fiscal year.
CED regularly tables Supplementary Estimates to obtain funding for new programs and/or initiatives during the fiscal year.
End of the cycle – Public Accounts, the Departmental Results Report and the Auditor General’s Report
The Public Accounts of Canada and the Auditor General’s Annual Report are tabled by December 31 following the conclusion, in March, of the fiscal year to which they apply. Their review by the Standing Committee on Public Accounts completes the Government’s annual cycle of financial transactions.
Tabled in late autumn, the Departmental Results Report complements the Public Accounts of Canada by providing details about CED’s results and performance for the recently completed fiscal year.
Governor General Special Warrants
CED is entitled to Governor General Special Warrants when Parliament is dissolved due to an election. Governor General Special Warrants may be used to fund the normal operations of government, ongoing programs, contractual obligations or services to Canadians when funding is required for the public good.
Off-cycle funding request
Departments may use off-cycle funding obtained through a Memorandum to Cabinet and/or a Treasury Board Submission to implement government priorities. Off-cycle funding is an irregular mechanism used to respond to a particular context. In situations where requests for off-cycle funding are permitted, specific instructions and timelines are provided by the Treasury Board Secretariat.
Values and ethics
Under the responsibility of the People, Culture and Workplace Directorate, the Values and Ethics Code for the Public Sector outlines the values and expected behaviours that guide public servants in all activities related to their professional duties. The CED Code of Conduct provides context for the Values and Ethics Code for the Public Sector’s rules in light of the key risks inherent to CED’s mandate. These two codes are part of the conditions of employment for CED employees.
Factors of interest to the Minister and exempt staff
- Exempt staff members must assess their own conduct and make requests to public servants in light of the parameters of the Values and Ethics Code for the Public Sector, the values of which are respect for democracy, respect for people, integrity, stewardship and excellence.
- Ministers are responsible for preserving public trust and confidence in the integrity of public sector organizations and for upholding the tradition and practice of a professional non-partisan federal public sector. Ministers and their teams must support public servants in their duty to provide professional and frank advice.
- All members of Ministers’ offices are subject to certain provisions of the Conflict of Interest Act. They must also be aware of their post-employment obligations (Lobbying Act).
- Ministers’ exempt staff are subject to the Ethical Guidelines for Public Office Holders.
- Exempt staff cannot give direction to public servants, but they can ask for information or transmit the Minister’s instructions through the Deputy Minister / President or a designated contact person.
Relevant policies and legislative instruments
Proactive disclosure
Canada Economic Development for Quebec Regions (CED) is required to proactively disclose a number of documents, some of which pertain to your office. Processes are in place and the published information is available on open.gc.ca and on CED's website.
Disclosures involving Ministers’ offices directly
Transition binder and briefing materials
- Within four months for briefing materials prepared following the appointment of new ministers or deputy heads, as well as for documents prepared for appearances before parliamentary committees. Documents must be disclosed in both official languages and in a format accessible to the visually impaired.
Travel and hospitality
- Every three months, all costs committed to and spent on travel and hospitality by senior management (Minister, exempt staff, Deputy Minister and assistant deputy ministers).
- Annually, the total amount spent on travel, hospitality and conferences.
Briefing notes
- Every month, the titles and reference numbers of briefing notes sent to you or the Deputy Minister / President.
Question Period Notes
- Within one month after the last sitting days in June and December, all Question Period Notes prepared for the Minister in use on the last day of these sittings.
Other disclosures
Grants and contributions
- Every three months for agreements valued over $25,000, the amount of the grant/contribution, the name of the recipient and the municipality, the project description and the grant and contribution program.
Contracts
- Every three months for all contracts valued over $10,000.
- Annually for all contracts valued $10,000 and under.
Access to information requests
- Every month for completed access to information requests, the request number and summary, the disposition and the number of pages disclosed.
Wrongdoing
- Annually, a description of the founded wrongdoing, the request number, the findings, a brief description and the recommendations or suggested corrective measures.
Reclassifications
- Every three months, positions that have been reclassified.
Information management
Corporate Services Information Management supports departmental activities, including those of your office, aimed at ensuring business continuity. Information is an important component of government operations.
Four types of information
Your office’s information must be separated (electronically and physically) and managed according to the type of document to which it belongs. This classification is based on the different roles you perform and allows you to meet their specific requirements.
- Government documents
Documents created or received by the federal institution or the Minister. These documents are linked to and support the institution’s mandate. They are subject to the Access to Information Act and must be managed in the same way as departmental documents. - Ministerial documents
Documents created solely for use by the Minister regarding the management of the Minister’s office or other departmental business. Even though they involve information relating to the institution, they are not disclosed to the institution. These documents are also subject to the Access to Information Act and must be managed in the same way as departmental documents. - Personal and political documents
Documents relating to the day-to-day business of the electoral district; political party-related matters; and privacy issues or the personal interests of the Minister. These documents are exempt from the Access to Information Act. - Cabinet documents
Documents managed by or for the Privy Council Office (PCO), such as Treasury Board documents. The Information Management Team will inform you of the specific management rules that apply.
Protection of information
In addition to their responsibilities related to the Values and Ethics Code, everyone in your office must ensure that information obtained or created is adequately protected through appropriate physical and electronic means, and by properly marking your documents.
There are three types of markings:
- If disclosed in an unauthorized manner, the information in protected documents (Protected A, B or C) could cause injury to a natural or legal person.
- If disclosed in an unauthorized manner, the information in classified documents (Confidential, Secret or Top Secret) could harm the national interest.
- Cabinet documents (confidences of the Privy Council) have their own markings and, if disclosed in an unauthorized manner, could prejudice the national interest and the upholding of democracy.
Designated person
To facilitate your information management obligations, it is strongly recommended that you designate a member of your team to oversee information management.
Relevant policy and legislative instruments
- Policies for Ministers’ Offices – January 2011
- Guidelines on Managing Records in a Minister’s Office
- Policy on the Security of Cabinet Confidences, 2014 (PCO)
- Confidences of the Queen’s Privy Council for Canada (Cabinet confidences)
- Policy on Service and Digital
Acronyms
Acronyms commonly used at CED
Programs and Initiatives
REGI
Regional Economic Growth through Innovation
CEF
Canadian Experiences Fund
SAI
Steel and Aluminum Initiative
EDI
Economic Development Initiative - Official Languages
CFP
Community Futures Program
QEDP
Quebec Economic Development Program
ITB
Industrial and Technological Benefits
WES
Women Entrepreneurship Strategy
Key Federal Partners
AAFC
Agriculture and Agri-Food Canada
RDA
Regional Development Agencies
ACOA
Atlantic Canada Opportunities Agency
CanNor
Canadian Northern Economic Development Agency
CED
Canada Economic Development for Quebec Regions
CIRNAC
Crown-Indigenous Relations and Northern Affairs Canada
DFO
Department of Fisheries and Oceans Canada
NSERC
Natural Sciences and Engineering Research Council of Canada
CBSC
Canada Business Service Centre
DC
Destination Canada
ECCC
Environment and Climate Change Canada
EDC
Export Development Canada
ESDC
Employment and Social Development Canada
FIN
Finance Canada
INFC
Infrastructure Canada
IRCC
Immigration, Refugees and Citizenship Canada
ISC
Indigenous Services Canada
ISED
Innovation, Science and Economic Development Canada
NRCan
Natural Resources Canada
PCH
Canadian Heritage
PSPC
Public Services and Procurement Canada
StatCan
Statistics Canada
TBS
Treasury Board of Canada Secretariat
TC
Transport Canada
WD
Western Economic Diversification Canada
Key Provincial Partners
IQ
Investissement Québec
MAMH
Ministère des Affaires municipales et de l’Habitation
MAPAQ
Ministère de l’Agriculture, des Pêcheries et de l’Alimentation
MEI
Ministère de l’Économie et de l’Innovation
MERN
Ministère de l’Énergie et des Ressources naturelles
MFFP
Ministère des Forêts, de la Faune et des Parcs
MTO
Ministère du Tourisme
MTQ
Ministère des Transports du Québec
SQRC
Secrétariat du Québec aux relations canadiennes
Key Partners / Organizations
RTA
Regional tourism associations
BDC*
Business Development Centre
CCTT
College centres for the transfer of technology
CEDC
Community Economic Development Corporation
CLD
Local development centre
OECD
Organization for Economic Cooperation and Development
ORPEX
Regional export promotion organizations
CFDC
Community Futures Development Corporation
UMQ
Union des municipalités du Québec
Government Operations
GBA+
Gender-based analysis plus
DRF
Departmental Results Framework
MAF
Management Accountability Framework
SOR
Strategic and Operating Review
FTE
Full-time equivalent
ARLU
Annual Reference Level Update
DP
Departmental Plan
PTP
Policy on Transfer Payments
QFR
Quarterly Financial Report
DRR
Departmental Results Report
SDS
Sustainable Development Strategy
G&Cs
Grants and Contributions
MRRS
Management, Resources and Results Structures
Other Common Acronyms
GBA+
Gender-based analysis plus
DRF
Departmental Results Framework
MAF
Management Accountability Framework
SOR
Strategic and Operating Review
FTE
Full-time equivalent
ARLU
Annual Reference Level Update
DP
Departmental Plan
PTP
Policy on Transfer Payments
QFR
Quarterly Financial Report
DRR
Departmental Results Report
SDS
Sustainable Development Strategy
G&Cs
Grants and Contributions
MRRS
Management, Resources and Results Structures